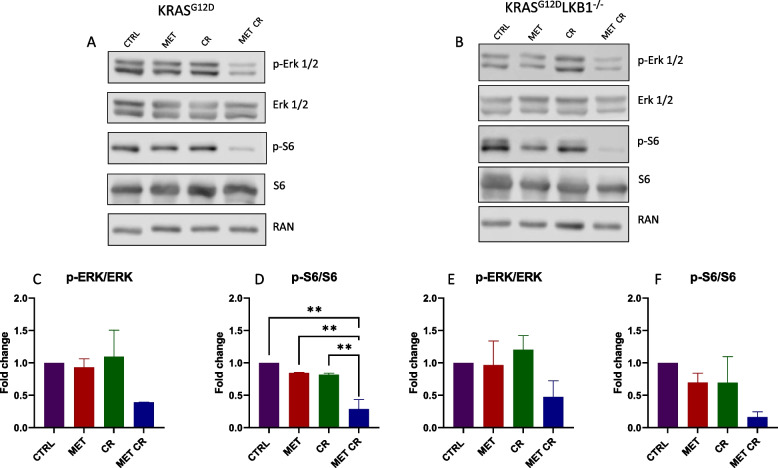
Fig. 4.
In vitro effect of metformin and CR treatments on mTOR and MAPKs proliferative pathways: Representative immunoblot analysis of total and phosphorylated forms of extra-cellular signal-regulated kinase (ERK 1/2) and S6 ribosomal protein (S6) in KRASG12D (A) and KRASG12D/LKB1del(B) cell lines. C-F Bar graphs of the quantification analysis of the active forms of ERK and S6 normalized on RAN, used as housekeeping. Proteins were extracted after 72 h of treatment with 2 mM of metformin (MET) and 50% caloric restriction (CR). Non-treated cells were used as control. One-way ANOVA was used for statistical analysis (**p < 0.01). Error bars indicate SD

