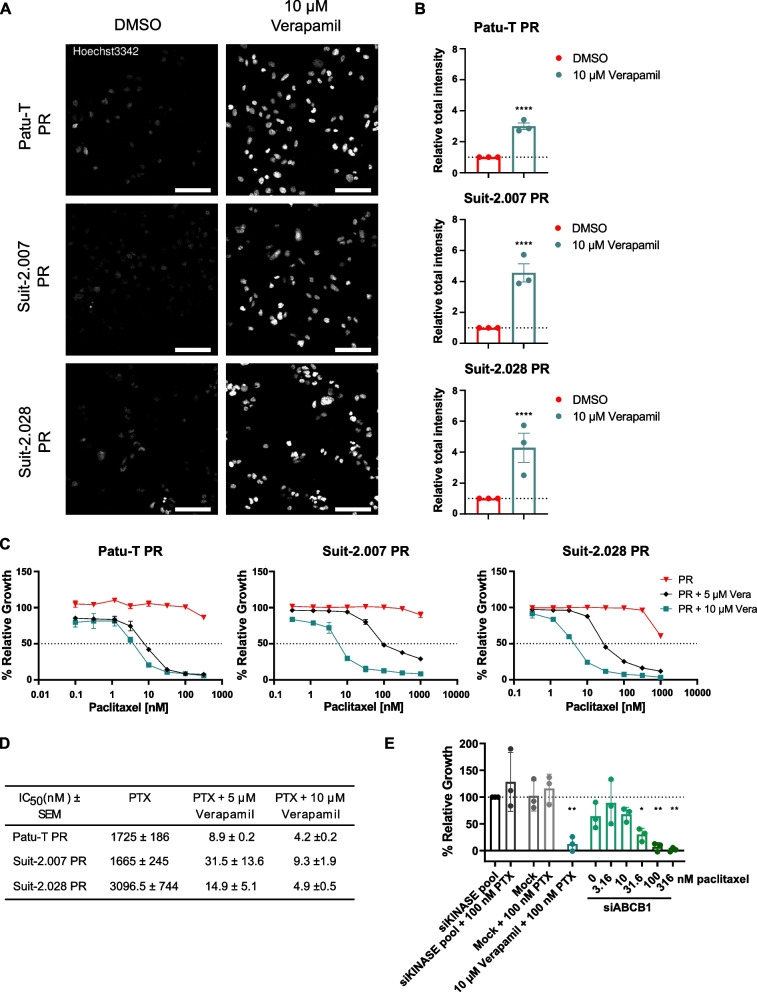
Fig. 3.
ABCB1 inhibition restores PR cell lines paclitaxel sensitivity. A Representative confocal images of PDAC PR cell lines treated O/N with either 10 μM verapamil or DMSO as a control and stained with 1 μg/mL of Hoechst33342 for 2 h at 37 °C in growth medium. Scale bar: 100 μm. B Quantification of Hoechst signal total intensity with CellProfiler upon DMSO (red) or 10 μM verapamil (green) treatment. C Representative growth curves of the 3 PR resistant cell models exposed for 72 h to paclitaxel concentration ranges, combined with 0.1% DMSO (red triangles), 5 μM verapamil (black diamonds) or 10 μM verapamil (green squares). Mean and SD of triplicates is shown. D Concentrations of paclitaxel causing 50% reduction in cell growth determined in absence or presence of 5 μM or 10 μM verapamil. Mean ± SEM for 3 independent experiments is displayed. As 50% growth inhibition was not fully reached in PR cells exposed to only paclitaxel, values from Supplemental Table S2 are displayed. E Relative proliferation (compared to siKINASEpool control) of Patu-T PR cells 72 h post-treatment with the indicated siRNA SMARTpools (50 nM) and paclitaxel concentrations, analyzed by SRB assay. Verapamil is used as positive control for ABCB1 inhibition

