Fig. 4.
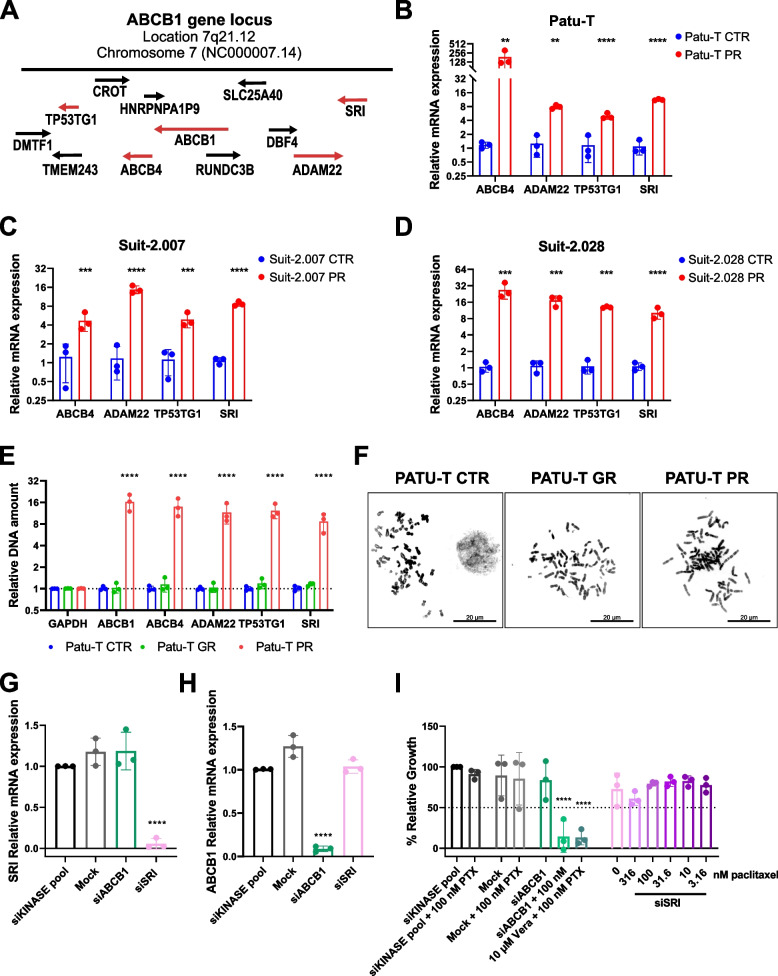
Expression of genes in ABCB1 locus is upregulated in PR cells. A Graphic visualization of ABCB1 amplicon on the locus 7q21.12. B-D Gene expression of ABCB4, ADAM22, TP53TG1 and SRI measured by RT-qPCR in PR (red) relative to CTR cells (blue) for the 3 indicated cell models. Brown-Forsythe and Welch ANOVA with Dunnet’s T3 post hoc test was used E Relative DNA amount of GAPDH, ABCB1, ABCB4, ADAM22, TP53TG1 and SRI in Patu-T CTR (blue), GR (green) and PR (red) cells, measured by DNA-qPCR and calculated as fold change (2−ΔΔCt compared to the parental). F Representative images of Patu-T CTR, GR and PR cell metaphases stained with DAPI. Note absence of ecDNA. Scale bar: 20 μm. G-H Gene expression of SRI (G) and ABCB1 (H) in Patu-T PR cells transfected with the indicated siRNA SMARTpools (50 nM) measured by RT-qPCR relative to siKINASEpool samples. I Cell growth of Patu-T PR cells 72 h post-treatment with the indicated siRNA SMARTpools and paclitaxel concentrations, relative to siKINASEpool control samples. Verapamil (Vera) is used as positive control for ABCB1 inhibition

