Fig. 5.
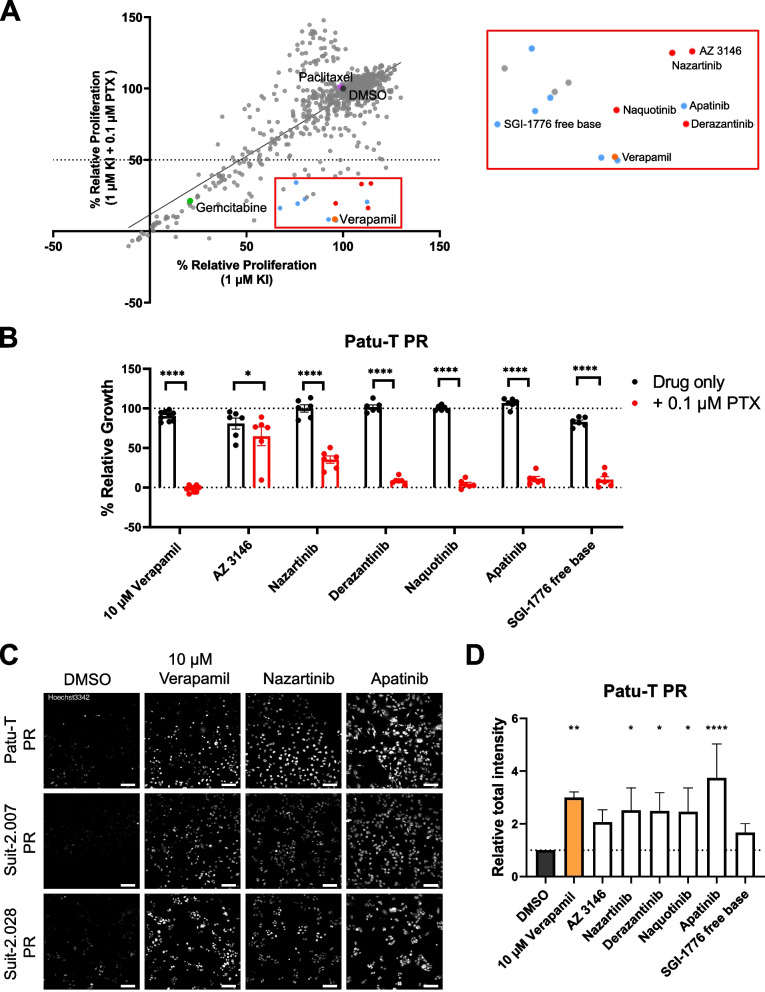
KI library screen to identify synthetic lethalities with paclitaxel in PR PDAC cells. A Scatter plot showing relative proliferation of Patu-T PR cells treated with 760 KIs (1 μM) in absence or presence of 0.1 μM paclitaxel, as assessed by SRB. Dots represent the mean of two independent experiments. Labeled dots indicate 0.1% DMSO control (dark grey), 0.1 μM paclitaxel only (purple), 0.1 μM gemcitabine (green), and 10 μM verapamil (orange). Red box, enlarged on the right, indicates compounds synergizing with paclitaxel, and blue dots indicate compounds already known to interact with ABCB1. B Confirmation of screen hits. KIs were tested at 1 μM concentration in combination with DMSO (black) or 0.1 μM paclitaxel (red) and proliferation was assessed after 72 h of treatment. Dotted line represents DMSO control (100%). KIs were tested in technical duplicates and controls in triplicates. Mean and SD from 3 independent experiments is displayed (dots indicate individual data points). Ordinary one-way ANOVA was performed, followed by Šídák’s multiple comparisons test. C Representative confocal images of PDAC PR cell lines treated O/N with either 1 μM KIs, 10 μM verapamil or DMSO as a control and stained with 1 μg/mL of Hoechst33342 for 2 h at 37 °C in growth medium. Scale bar: 100 μm. D Quantification of Hoechst signal total intensity with CellProfiler upon the different treatments. Dotted line represents Relative total intensity = 1

