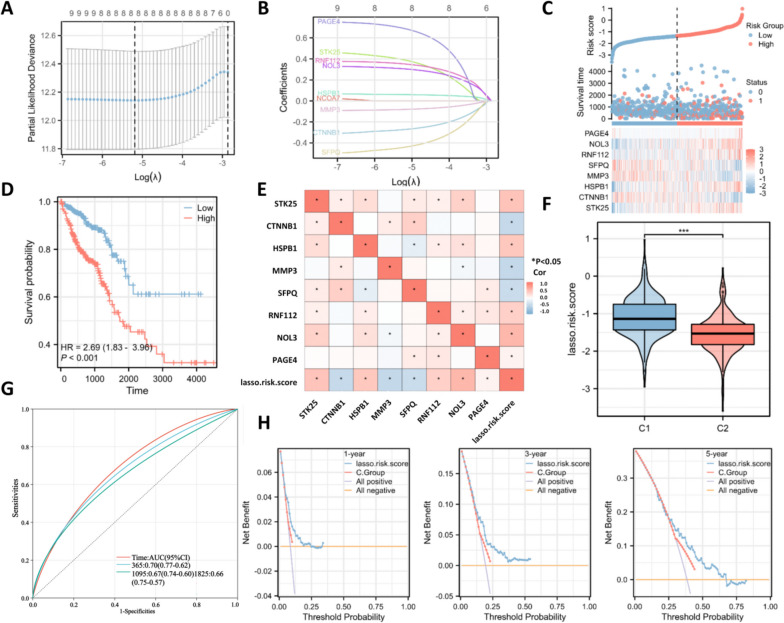
Fig. 4.
Construction of the prognostic risk model with OS-related genes. A The best lambda value was screened by Lasso regression. B The coefficient profiles of each oxidative stress-related gene; C The risk score, survival outcome, and heatmap of 8 oxidative stress-related genes in CRC patients. D Survival curves of CRC patients in indicated groups. E Correlation between the levels of 8 oxidative stress-related genes and the Lasso risk score. F Profile of the Lasso risk score in the C1 and C2 subtypes. G The ROC curves were used to evaluate the accuracy of prognostic risk models. H Decision curve analysis (DCA) curves were used to evaluate the net benefits of the models

