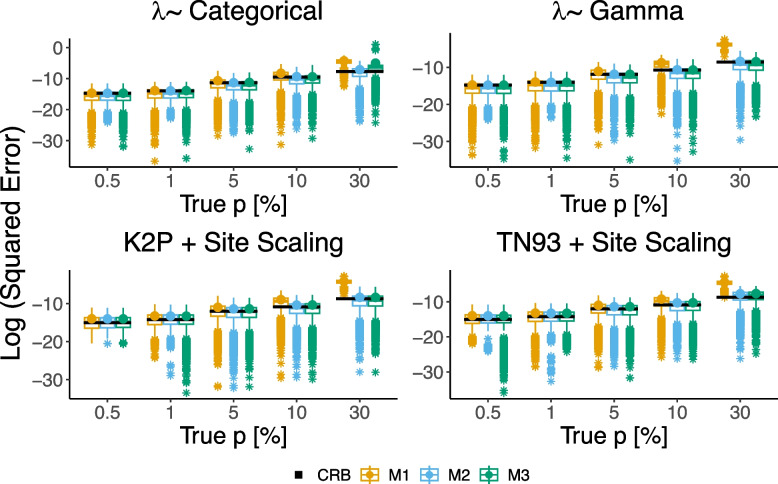
Fig. 2.
Box-plot of the log squared estimation errors of the three proposed methods for selected values of p, expressed as a percentage of the total length of Phylotree’s edges (outliers are marked with ). The simulations were run 10, 000 times for each value of p. The CRB is shown in black for reference and the circles represent the log of the mean values which are comparable to the CRB. The experiments were conducted for two different distributions of and two different substitution models: (Top left) Categorical distribution with two values: with probability and with probability .(Top right) Gamma distribution with parameters and . (Bottom left) Site-scaled K2P substitution model. (Bottom right) Site-scaled TN93 substitution model

