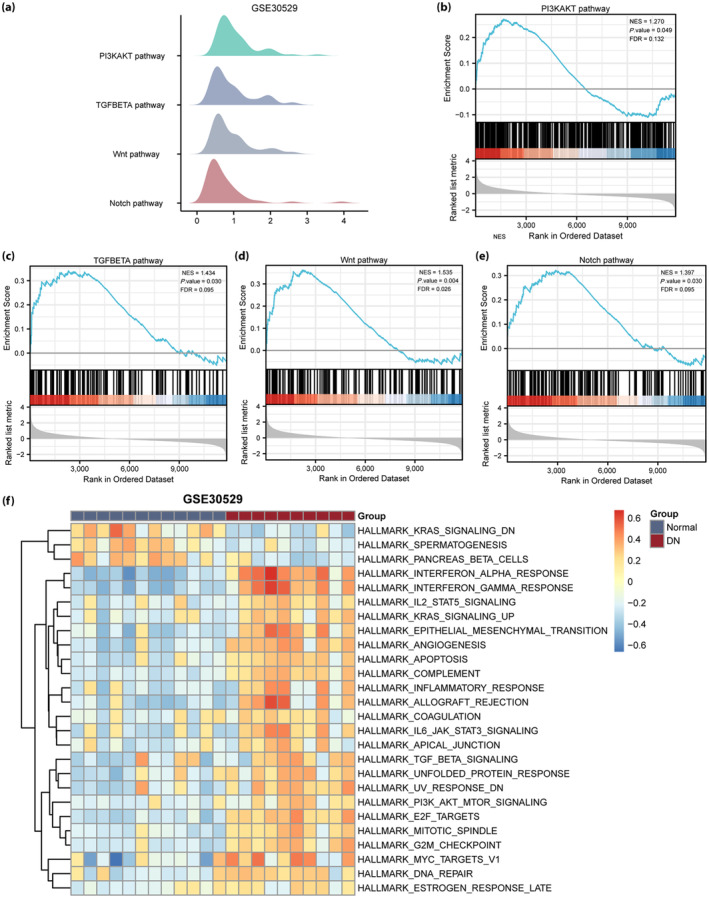
Figure 6.

Gene set enrichment analysis and gene set variation analysis of the diabetic nephropathy (DN) GSE30529 dataset. (a) The main gene set enrichment analysis pathway in the GSE30529 dataset. (b–e) The differentially expressed genes in the GSE30122 dataset were significantly enriched in the phosphoinositide 3‐kinase (PI3K/AKT), transforming growth factor (TGF)‐β (Figure 6c), Wnt (Figure 6d) and Notch (Figure 6e) pathways. (f) Gene set variation analysis in the GSE30529 dataset (P < 0.05 and false discovery rate [FDR] <0.25). Blue represents the healthy group, and red represents the DN group. NES, normalized enrichment score.
