
Figure 11.
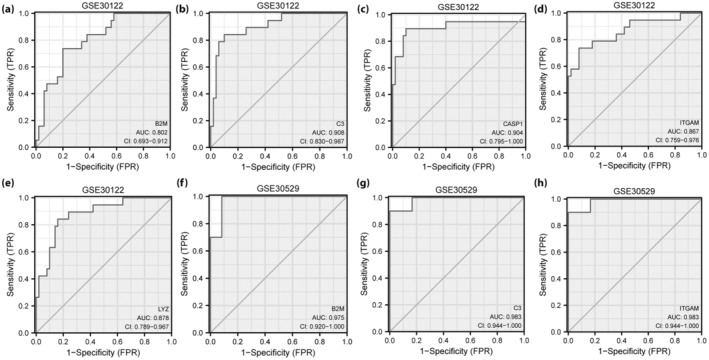
Receiver operating characteristic curve analysis of hub genes. (a–d) Receiver operating characteristic curve analysis of hub genes (a) B2M, (b) C3, CASP1 (c), (d) ITGAM and (e) LYZ in the GSE30122 dataset. (f–h) Receiver operating characteristic curve analysis of hub genes (f) B2M, (g) C3 and (h) ITGAM in the GSE30529 dataset. FPR, false positive rate.