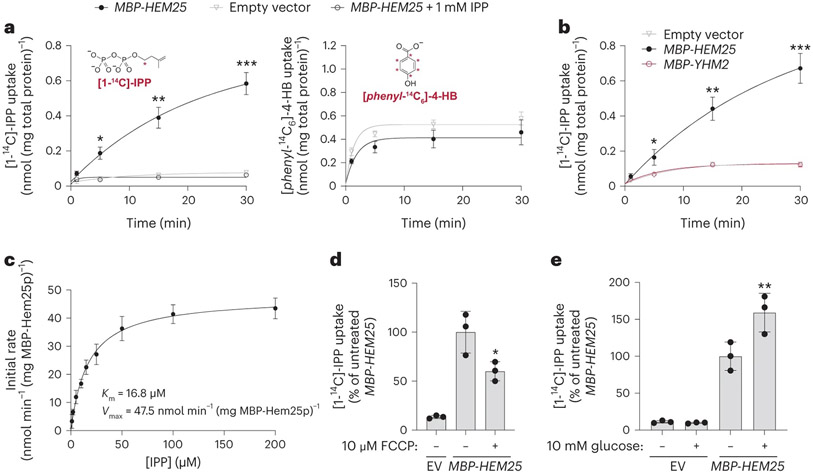
Fig. 4: Hem25p enables IPP import in bacteria.
a, Time course of 50 μM [1-14C]-IPP (left) or 50 μM [phenyl-14C6]-4-HB (right) uptake by E. coli cells expressing MBP-Hem25p. Cells carrying the empty expression vector and competition by excess unlabelled IPP were used as controls (*P = 0.0023, **P = 0.0006, ***P = 0.0001 empty vector versus MBP-HEM25, mean ± s.d., n = 3 biologically independent samples, two-sided Student’s t-test). b, Time course of 50 μM [1-14C]-IPP uptake by E. coli cells expressing MBP-Hem25p, MBP-Yhm2p, or the empty vector (*P = 0.0165, **P = 0.0012, ***P = 0.0003 empty vector versus MBP-HEM25, mean ± s.d., n = 3 biologically independent samples, two-sided Student’s t-test). c, Steady-state kinetics of [1-14C]-IPP uptake. For each time point, the corresponding empty vector control was subtracted. Data reflect the mean ± s.d. from three biologically independent samples. d,e, Relative E. coli [1-14C]-IPP uptake in the presence of 10 μM FCCP (d) or 10 mM glucose (e). IPP uptake levels reflect 30 min of incubation time and are relative to the respective vehicle-treated MBP-HEM25 (*P = 0.0419 MBP-HEM25 ± FCCP, **P = 0.0346 MBP-HEM25 ± glucose, mean ± s.d., n = 3 biologically independent samples, two-sided Student’s t-test). Numerical data are available as Source data.

