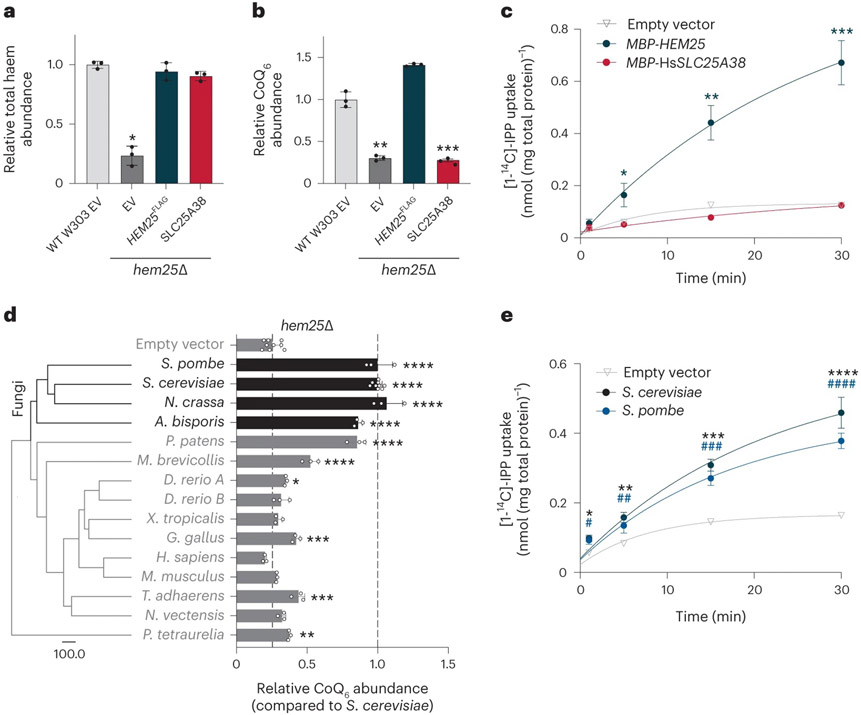
Fig. 6: Hem25p’s role in CoQ biosynthesis is conserved in fungi.
a,b, Haem (a) and CoQ (b) rescue by SLC25A38 in hem25Δ yeast. Levels are relative to the WT strain carrying the empty expression vector (*P = 0.0001, **P = 0.0002, ***P = 0.0001, mean ± s.d., n = 3 biologically independent samples, two-sided Student’s t-test). c, Time course of 50 μM [1-14C]-IPP uptake by E. coli cells expressing MBP-SLC25A38 and MBP-Hem25p. Uptake by cells carrying the empty expression vector is included as a control (*P = 0.0165, **P = 0.0012, ***P = 0.0003 empty vector versus MBP-HEM25, mean ± s.d., n = 3 biologically independent samples, two-sided Student’s t-test). d, Phylogenetic analysis of Hem25p orthologues and relative CoQ abundance in hem25Δ cells expressing these orthologues. The scale bar represents evolutionary distance, indicating the number of aminoacid substitutions per site. Levels are relative to that of the S. cerevisiae Hem25p (****P < 0.0001, ***P < 0.001, **P < 0.01, *P < 0.05 versus empty vector; mean ± s.d., at least three biologically independent samples, two-sided Student’s t-test). e, Time course of [1-14C]-IPP uptake by E. coli cells expressing S. cerevisiae Hem25p, S. pombe Hem25p, or the empty vector (*P = 0.0016, **P = 0.001, ***P = 9.51 × 10⁻⁵, ****P = 0.0003 empty vector versus S. cerevisiae Hem25p, #P = 0.0074, ##P = 0.0153, ###P = 0.0005, ####P = 8.48 × 10⁻⁵ empty vector versus S. pombe Hem25p, mean ± s.d., n = 3 biologically independent samples, two-sided Student’s t-test). Numerical data are available as Source data.

