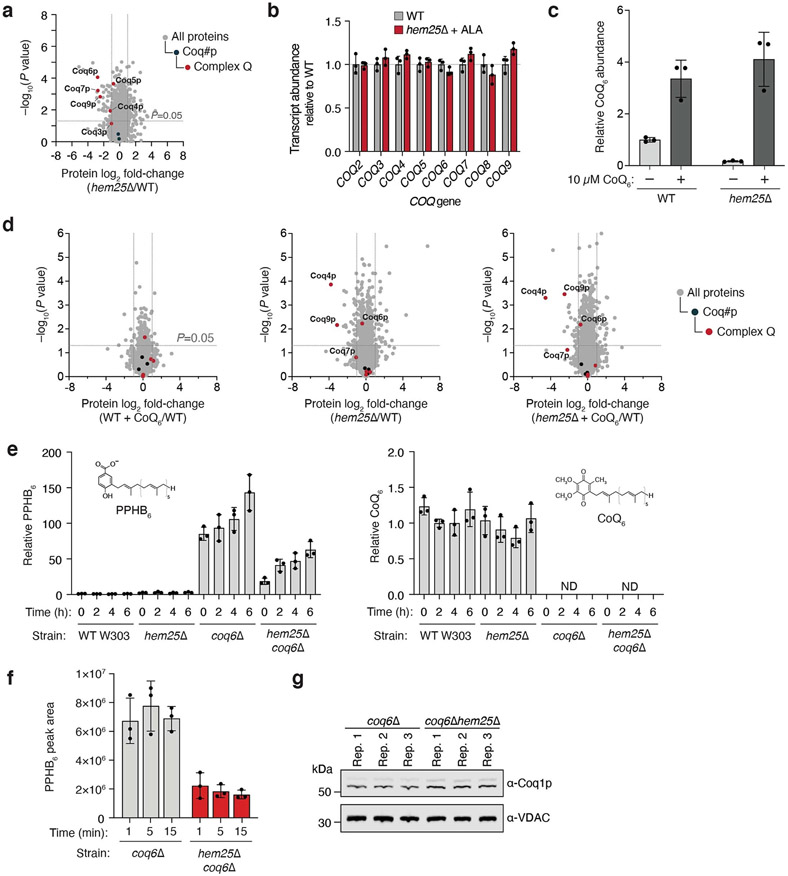
Extended Data Fig. 1. Hem25p drives CoQ production independently of its role in heme biosynthesis.
a, Relative protein abundances of hem25Δ cells compared to WT cells versus statistical significance. CoQ biosynthetic proteins and Complex Q proteins are highlighted. Raw data from the Y3K dataset33(respiration-RDR condition) are displayed as the mean from three biologically independent samples with two-sided Student’s t-test used. b, Relative transcript abundances of CoQ biosynthetic genes from hem25Δ with ALA supplementation compared to WT cells without ALA supplementation (mean ± SD, n = 3 biologically independent samples). c, Relative CoQ6 abundances in WT and hem25Δ yeast. Cells were treated with either vehicle (ethanol) or 10 μM CoQ6. CoQ6 supplementation raised the cellular CoQ levels of WT and hem25Δ yeast to similar levels (p = 0.3642 WT+CoQ6 vs hem25Δ+CoQ6, mean ± SD, n = 3 biologically independent samples). d, Relative protein abundances of WT cells with CoQ6, hem25Δ cells without CoQ6, and hem25Δ cells with CoQ6 compared to WT cells without CoQ6(mean, n = 3 biologically independent samples, two-sided Student’s t-test). e, Relative abundance of unlabeled PPHB and CoQ in WT, hem25Δ, coq6Δ, and coq6Δhem25Δ yeast from the experiment in Fig. 2d (mean ± SD, n = 3 biologically independent samples); ND, not detected. f, Normalized abundance of unlabeled PPHB levels in isolated coq6Δ and coq6Δhem25Δ mitochondria (mean ± SD, n = 3 biologically independent samples). g, Coq1p levels in isolated mitochondria from each replicate, assessed by immunoblotting. Source numerical data and unprocessed blots are available in source data.

