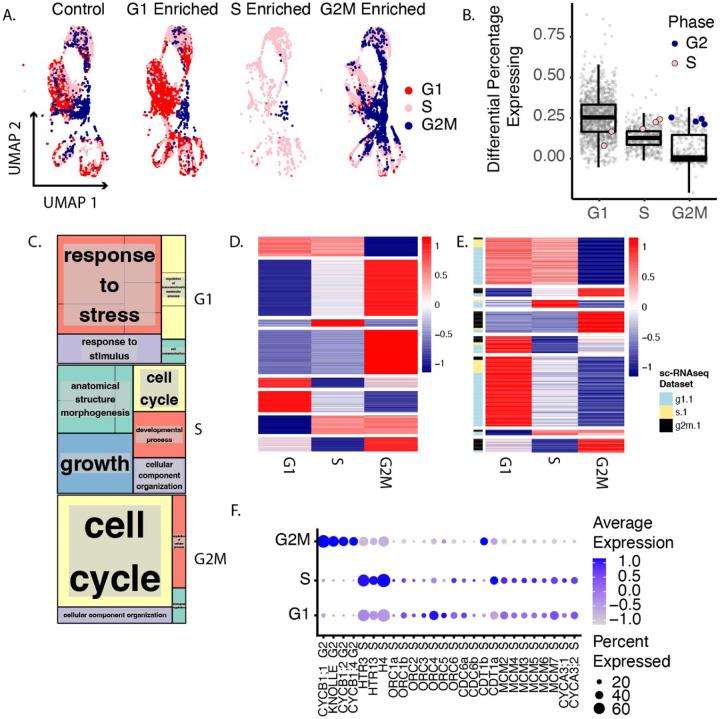
Fig. 2.
A. single cells colored coded by phase plotted in UMAP space. Libraries are separated by treatment condition. B. Differentially expressed genes ranked by the differential percentage of cells in each group expressing each gene. The highlighted genes are gold standard markers of phase-specific expression. The appropriate genes for each phase are highly ranked in the appropriate phase enriched library (x axis categories). C. Enriched GO terms for each top 50 marker set per phase grouped by semantic similarity. D. K means clustering of ploidy-sorted cells sequenced with bulk RNA-seq. Columns are the average expression of technical replicates, rows are genes. E. Intersected K means clusters with genes that are differentially expressed between phase-enriched single cell libraries, with the enriched library indicated by the color bar to the left of the heatmap. Broadly there is good agreement between the phase assignment of genes between these two methods. F. A dot plot showing the expression of gold standard cell cycle phase markers. Cells are grouped by phase assigned in Seurat using the top 50 genes most associated with S and G2M.

