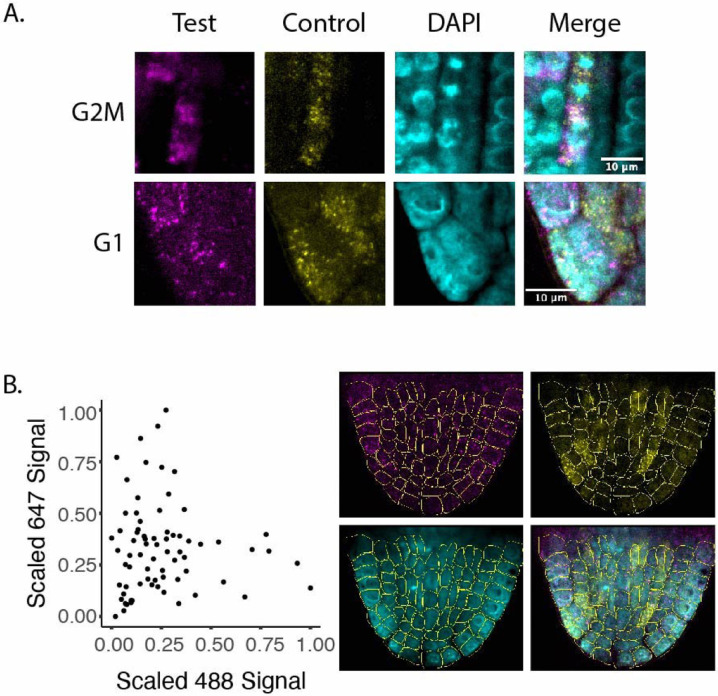
Fig. 3.
A. In situ hybridization for novel G1 and G2M probes. Known markers, shown in yellow, were hybridized with probes that fluoresce in the 488 nm range. Novel markers (magenta) were hybridized with probes that fluoresce in the 647 nm range. In the case of the G1 experiment, the control probe marks cells in S phase, as a strong G1 transcriptional marker was not already validated. B. Quantification of 488 and 647 signal for all cells in a recently emerged lateral root show an anticorrelation between cells with strong staining for the S phase probe (488) and the G1 phase probe (647). Segmented images are shown to the right.

