Fig. 4.
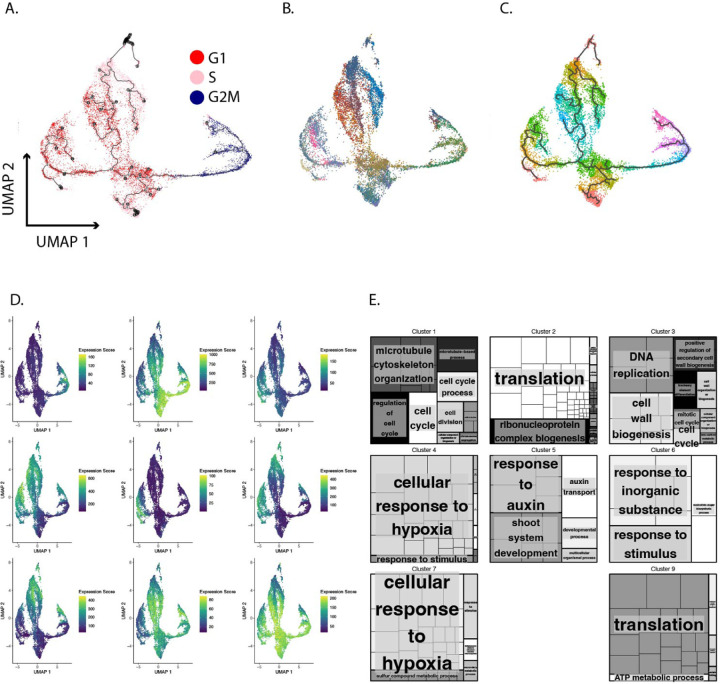
Cells were aligned in pseudotime using only genes highly associated with the cell cycle. A. UMAP of cells color coded by phase assigned in Seurat. B. UMAP of cells color coded by cell type. C. Cells are separated into 10 bins equally spaced along pseudotime. Cells are color coded to reflect their bin D. We performed hierarchical clustering of genes that are differentially expressed across psuedotime based on their expression in the bins shown in figure 4C. This resulted in identification of nine expression patterns shown here in UMAP space. Each UMAP shows the cumulative expression of a cluster of genes where blue is low and yellow is high. E. GO terms for genes in each expression cluster.

