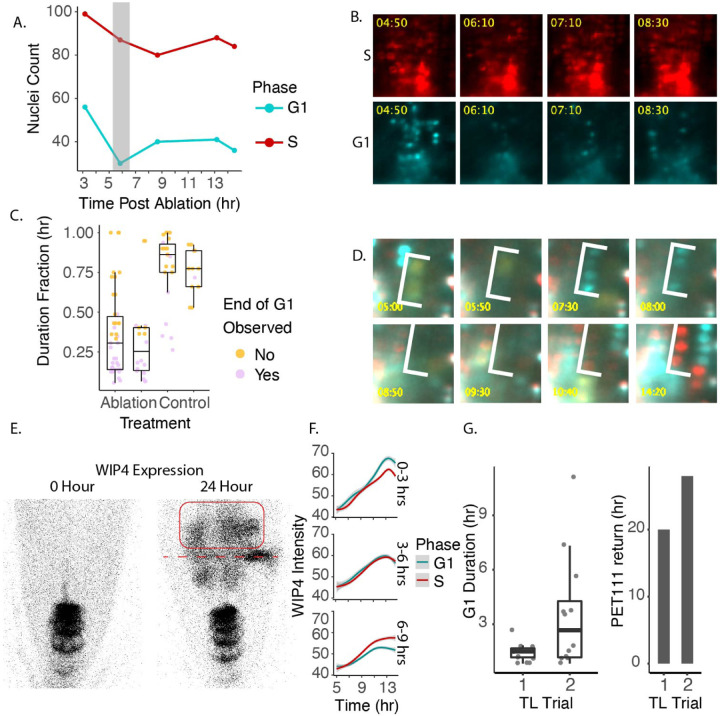
Fig. 5.
A. Quantification of the coordinated G1 exit, wherein cells leave G1 phase simultaneously around 6 HPA. B. Representative images of coordinated G1 exit. S phase cells, shown in red, serve here as a control to demonstrate that only the CFP signal disappears transiently during this time period. C. Quantification of G1 duration as a fraction of the total length of the time lapse. D. Representative example of a short G1 in which cells pass through the phase in as little as 2 hours. E. Representative image of WIP4 expression domain before ablation and also 24 HPA. The red box indicates the new WIP4 expression domain. The red dotted line marks the location of the ablation. F. Quantification of WIP4 signal over time in G1 and S phase cells. Cells are separated based on the observed G1 duration. G. Quantification of G1 duration alongside timing of PET111 expression establishment in the regeneration domain.

