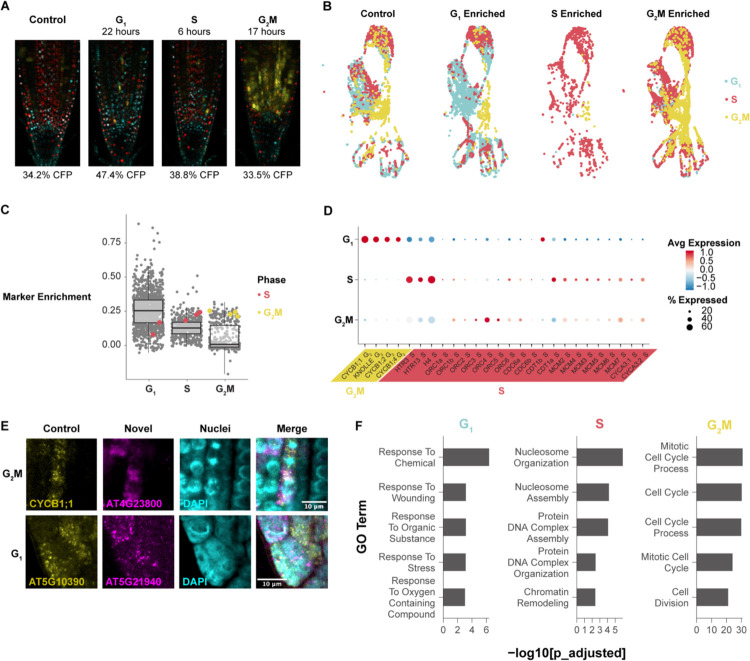
Figure 1: Single-cell phase synchronized cells yield robust transcriptional markers for each phase of the cell cycle.
(A) Representative images of phase enrichments achieved with HU synchronization using seedlings expressing the PlaCCI reporter. G1 cells are shown in cyan, S cells are shown in red, and G2/M cells are shown in yellow. (B) An unsynchronized control and three single cell profiles collected at specific times after synchronization integrated in UMAP with cells color coded by phase determination. Cells from each time point were separated after integration. (C) Genes (each dot) categorized as differentially expressed in specific phase-synchronized libraries. The y axis represents the difference in the percentage of cells in which the gene is expressed in target versus non-target libraries. The highlighted genes are gold standard markers of phase-specific expression, showing high expression in many cells in the appropriate phase-synchronized library (x axis categories). (D) A dot plot showing expression of gold standard cell-cycle phase markers, showing known G2/M-phase markers (CYCBs) followed by known S-phase markers. (E) In situ hybridization of novel G1 and G2/M probes. Known markers are shown in yellow and new markers in magenta. The new G2/M marker is hybridized with a known G2/M marker, showing overlap. The new G1 marker is hybridized with a known S marker, showing spatial anticorrelation. (F) The top five most statistically significantly enriched GO terms in the top 50 phase marker set for each phase. See also Figures S1–S5 and Tables S1–S3.

