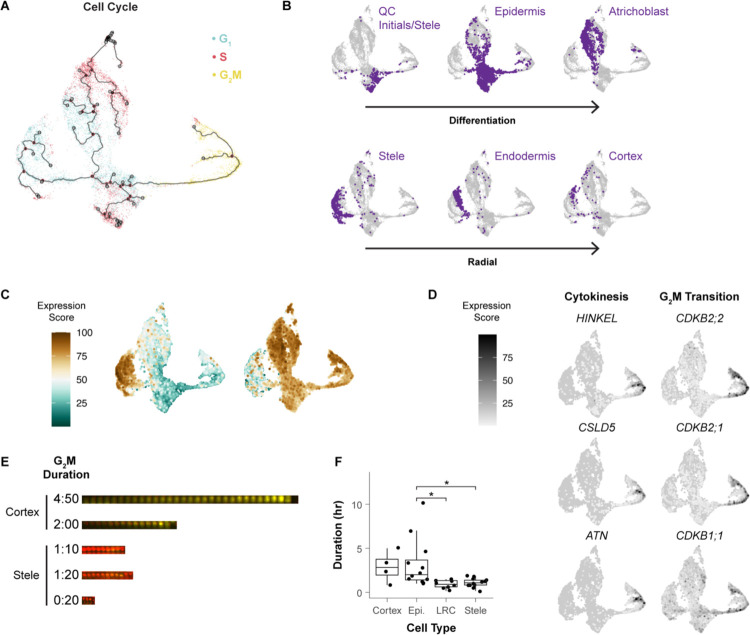
Figure 2: Different cell types follow different trajectories through the cell cycle.
(A) Pseudotime map of cells clustered using only cell cycle markers and colored by phase assigned in Seurat. (B) In the same UMAP clustering in A, cells were labeled by their independently determined cell identity, showing groupings by both developmental stage (e.g., QC region) and radial cell identity. Arrows indicate differentiation stage from young to older (top) inner to outer cell files (bottom). (C) Aggregate expression of genes enriched in either the epidermal or stele-endodermis-cortex G1 branch, which showed genes with differential functions. (D) UMAPs showing the expression of genes specific to sub-regions of the G2/M branch, with representative genes involved in cytokinesis (lower branch) and the G2/M transition (upper branch). (E) Variable lengths of G2/M phase marker expression shown within and between cell types, with representative time-lapse montages of the entire late G2/M period shown indicating duration. Red = HTR13 and yellow = CYCB1;1. (F) Quantification of G2/M duration for many cells. Asterisks represent significant differences in G2/M duration (pairwise t-test, p < 0.05). See also Figure S6, Table S3, and movie S1.

