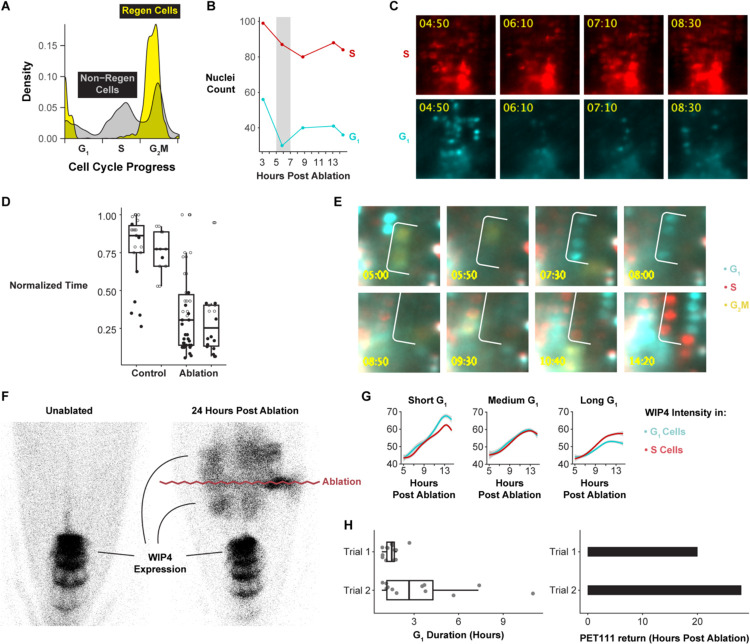
Figure 3: The G1 phase of the cell cycle is dramatically truncated in regenerating cells.
(A) Summary of the frequency of a given cell cycle phase in regenerating (yellow) and non-regenerating (grey) cells. Cells are aligned along a cell cycle pseudotime on the x axis, with their density shown on the y axis with G1 predominant in non-regenerating cells and almost absent in regenerating cells. (B) Quantification of the coordinated G1 exit, showing the coordinated depletion of cells in G1 phase around 6 hours post ablation (HPA) highlighted by grey shading. (C) Representative images of the coordinated G1 exit (bottom). S-phase cells (top) serve as a control showing a continuous strong signal (no depletion) in the same roots. (D) Quantification of G1 duration in control and ablated roots for two trials. Time is normalized within each root. Filled dots represent cells in which the end of G1 was observed. (E) Representative time-lapse series of a short G1 in which cells pass through the phase in as little as 2 hours. (F) Representative image of WIP4 expression domain before ablation and 24 HPA. The purple wavy line marks the location of the ablation. (G) Quantification of WIP4 signal over time in G1 and S phase cells, with different plots showing analysis of cells grouped by the length of G1 or S. H. Quantification of G1 duration in two roots (left) and the timing of PET111 expression establishment in the regeneration zone in the same two roots (right) showing the association between G1 duration and PET11 appearance. Trials refer to individual root time lapses. See also Figure S7, Table S4–S5s, and Movies S2–S3.

