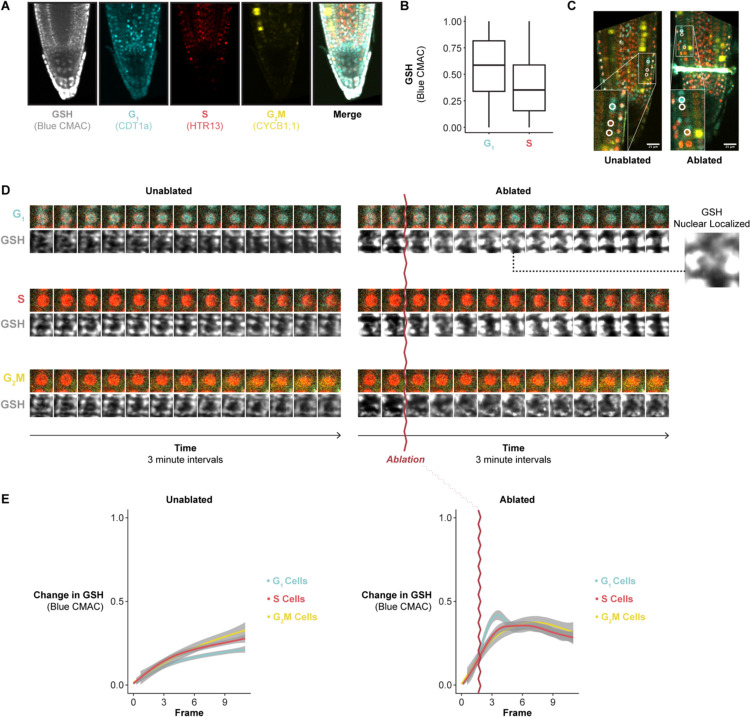
Figure 4: Regenerating cells import glutathione to the nucleus in G1.
(A) Representative confocal microscopy image of a PlaCCI seedling stained with blue CMAC overnight, showing phase markers and blue CMAC staining. (B) Quantification of blue CMAC in G1 and S phase nuclei. (C) Images showing the location of cells analyzed in 4D annotated (circles) and show in insets. All cells in these images were analyzed in 4E. (D) Representative images of cells in each phase of the cell cycle in control and ablated roots shown in a time-series montage. (E) Quantification of the of cumulative change in blue CMAC levels in nuclei of cells in each cell cycle phase in a control or an ablated root over time. Time 0 is the beginning of the time lapse, and the time of the ablation is shown in the right panel as a wavy purple line. Image frames were taken three minutes apart. The blue peak in ablated cells at 10 minutes shows G1 cells in the ablation time lapse experience a temporary increase in blue CMAC staining levels (GSH nuclear localization). See also Figure S8–S10 and Movie S4.

