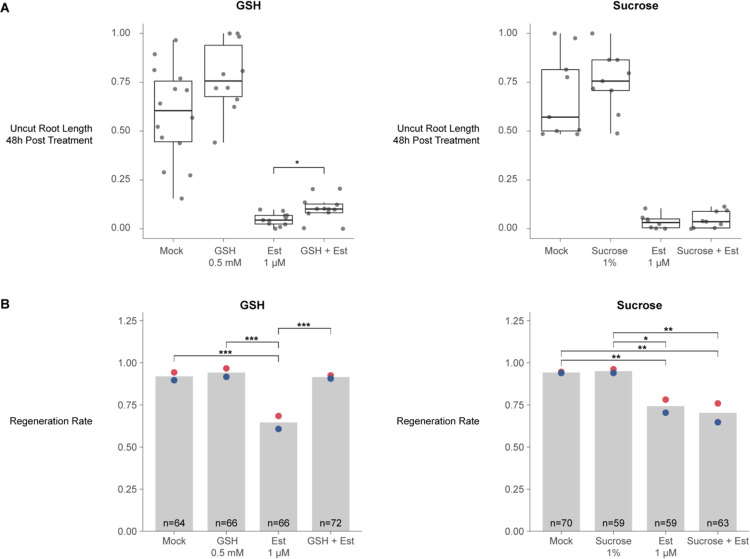
Figure 7: The ground tissue is a source of GSH in homeostatic growth and regeneration.
(A) Root growth post callose-synthase induction for each treatment condition. Root lengths are scaled from 0 to 1 within technical replicates to their own controls to render them comparable across batches. Statistical significance was determined by the pairwise t-test comparing estradiol or non-estradiol categories (i.e. mock was tested versus GSH and estradiol was tested versus estradiol + GSH). (B) At left, regeneration rates based on the gravitropism test at 48 HPC. The conditions are control (mock), GSH treated roots, estradiol-treated roots (induction of callose synthase expression to block transport out of the cortex and endodermis), estradiol + GSH treated roots. At right, the same treatments substituting 1 μM sucrose for GSH. Red and blue dots represent the regeneration rates of technical replicates.

