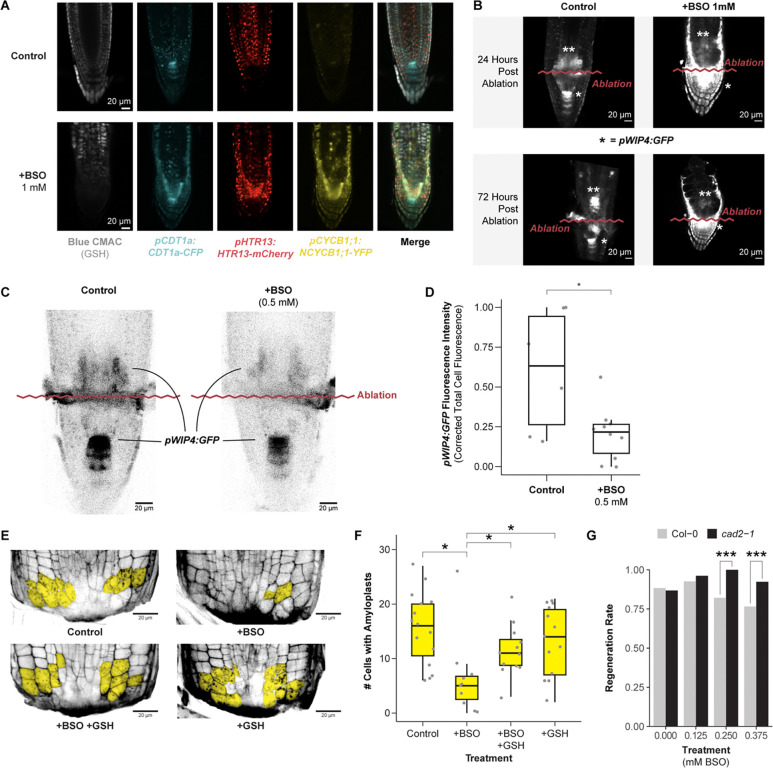
Figure 5: Depletion of GSH biosynthesis with BSO impairs regeneration and is rescued by exogenous GSH.
(A) 7 days post germination (dpg) root meristems (PlaCCI x pWIP4:GFP) grown on MS (control) or on MS+1mM BSO then stained overnight with Blue CMAC. (B) Representative images of the pWIP4:GFP signal in a median section of a control and BSO-treated root at 24 and 72 HPA. The ablation site is indicated with a wavy red line. The original QC within the stem cell niche is indicated with an asterisk (*), and the newly forming stem cell niche is marked with two asterisks (**). (C) Representative images of pWIP4:GFP signal 24 hpa in control and 0.5 mM BSO treatment. (D) Quantification of pWIP4:GFP signal in the regeneration zone of roots 24 HPA in control and 0.5 mM BSO treatment. The y-axis is the corrected total cell fluorescence of pWIP4:GFP in the new QC domain scaled to render experiments comparable between technical replicates (n=16 roots, p = 0.05 Wilcoxon test). (E) Representative images of regenerating root tips stained with mPS-PI to visualize cell walls and amyloplasts 18 hpc. Cells with amyloplasts are pseudo-colored in yellow. The treatments are control, 0.5 mM BSO, 0.5 mM GSH, or combined 0.5 mM BSO + 0.5 mM GSH. (F) Quantification of the number of cells with amyloplasts in a population of roots from each treatment group shown in E. (n=48 roots, * < 0.03, Wilcoxon test). Each dot represents a root. (G) Root tip regeneration rates (y-axis) for col-0 (grey) and cad2–1 (black) seedlings grown on increasing concentrations of BSO (x-axis). At higher concentrations, col-0 regenerates significantly less efficiently than cad2–1 (n>65 for each treatment group, p-value < 0.003,chi square test).

