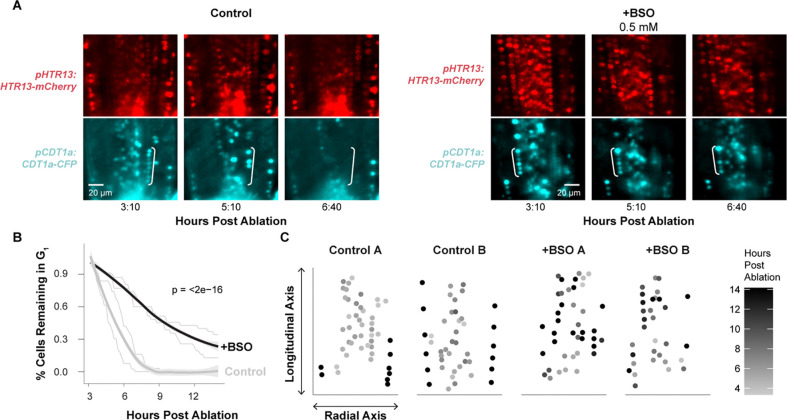
Figure 6: Depletion of GSH with BSO eliminates the coordinated exit from G1 and increases G1 duration in regeneration.
(A) Representative images from a control (left) and BSO treated time lapse (right) immediately shootward of the ablation site, showing the S phase (red) and G1 (cyan) markers. Cells from the cortex in G1 are bracketed to highlight the differential disappearance of G1 phase cells in control vs. post ablation. S phase cells are shown to confirm no change in their fluorescent signal. (B) G1 duration quantified in survivor curves, where cells in G1 were identified in the first frame of the time lapse and tracked until their transition to S phase for control (gray line) and BSO-treated (black line) time lapse experiments. Lightly colored lines are individual replicates, and the bold line is a LOESS regression of the two trials (p=<2e-16, n = 126 cells, controls are the same cells shown as “Ablated” in Fig. 3C, log rank test). (C) Grayscale representation of the time in hpa that cells exit G1 mapped onto the given cell’s coordinates within the roots, where the Y-intercept represents the ablation site and each dot represents a cell, with two example roots per condition (A,B). Shading scale represents time post ablation when a cell exited G1 phase.

