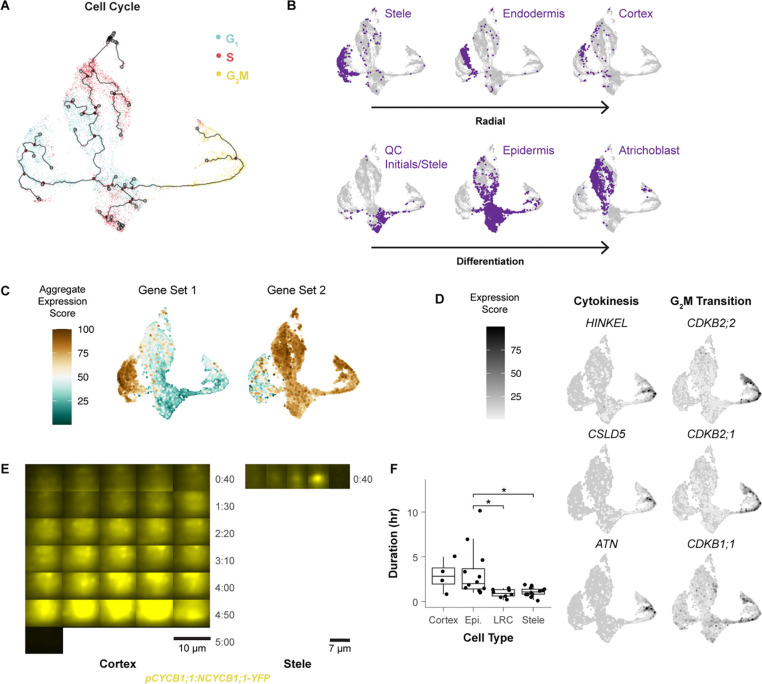
Figure 2: Different cell types follow different trajectories through the cell cycle.
(A) Pseudotime map of cells clustered using only cell cycle markers and colored by phase assigned in Seurat. (B) In the same UMAP clustering in A, cells were labeled by their independently determined cell identity, showing groupings by both developmental stage (e.g., QC region) and radial cell identity. Arrows indicate inner to outer cell files (top) and differentiation stage from young to older (bottom). (C) Aggregate expression of genes enriched in either the epidermal or stele-endodermis-cortex G1 branch, which showed genes with differential functions. (D) UMAPs showing the expression of genes specific to sub-regions of the G2/M branch, with representative genes involved in cytokinesis (lower branch) and the G2/M transition (upper branch). (E) Variable lengths of G2/M phase marker expression shown between one cortex and one stele cell. Each frame of each montage is ten minutes apart from time lapse movies taken with a Tilt light sheet system (Mizar). Each montage shows the frame at which pCYCB1;1:NCYCB1;1-YFP first becomes visible in the given cell to the frame where the reporter disappears, indicating the end of G2M. (F) Quantification of G2/M duration based on the amount of time pCYCB1;1:NCYCB1;1-YFP was visible for in many cells from two time lapses (n=36 cells). Asterisks represent significant differences in G2/M duration (p < 0.05, pairwise t-test). Each dot represents a cell. See also Figure S6, Table S3, and movie S1.

