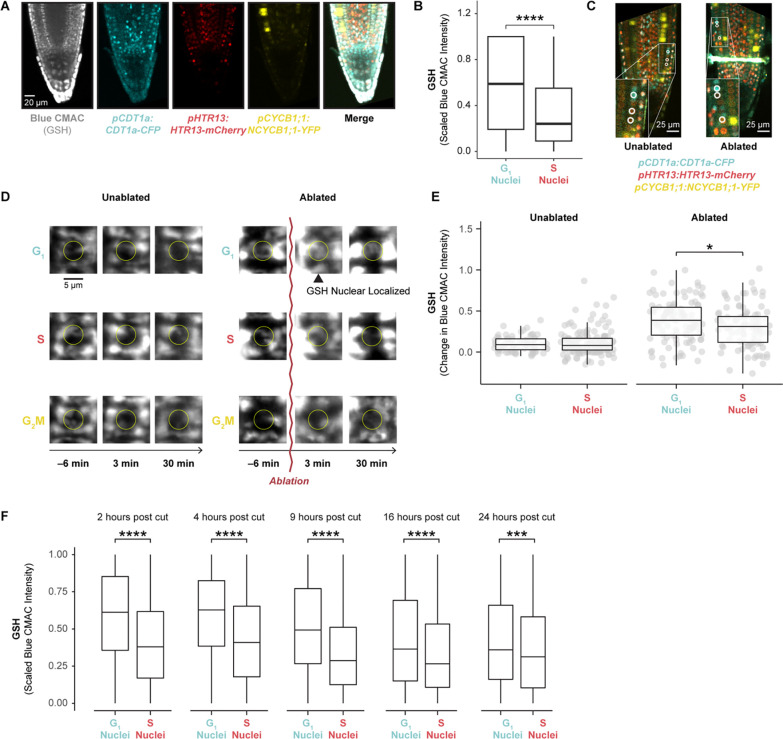
Figure 4: Regenerating cells import glutathione to the nucleus in G1.
(A) Representative confocal microscopy image of a PlaCCI seedling stained with Blue CMAC overnight, showing phase markers and Blue CMAC staining. (B) Quantification of Blue CMAC in G1 and S phase nuclei. (n= 416 nuclei, n=2 roots, p-value = 2.23e-10, student’s t test). (C) Images showing the location of cells analyzed in 4D annotated (circles) and shown in insets. All cells in these images were analyzed in 4E. (D) Representative images of cells in each phase of the cell cycle in control and ablated roots shown in a time-series montage. Time relative to ablation is shown. The yellow circle shows the position of the nucleus. (E) Quantification of the change in Blue CMAC levels in nuclei of cells in G1 and S phase in unablated and ablated roots. Each boxplot shows GSH signal measured in segmented nuclei from frame 3 of the relevant time lapse. In the case of the ablated root, this frame was taken 3 minutes post ablation. The y-axis represents the amount of nuclear GSH signal at frame three relative to the amount of GSH signal in those same nuclei at frame 1. Each dot represents a nucleus. (n=420 nuclei and 2 roots, p-value = 0.0296, student’s t test). (F) GSH levels are shown in segmented nuclei at various time points post cut in G1 and S phase cells (n=8632 nuclei, n=35 roots, *** <5e-4, ****<7e-9,student’s t test). See also Figure S8–S10 and Movie S4.

