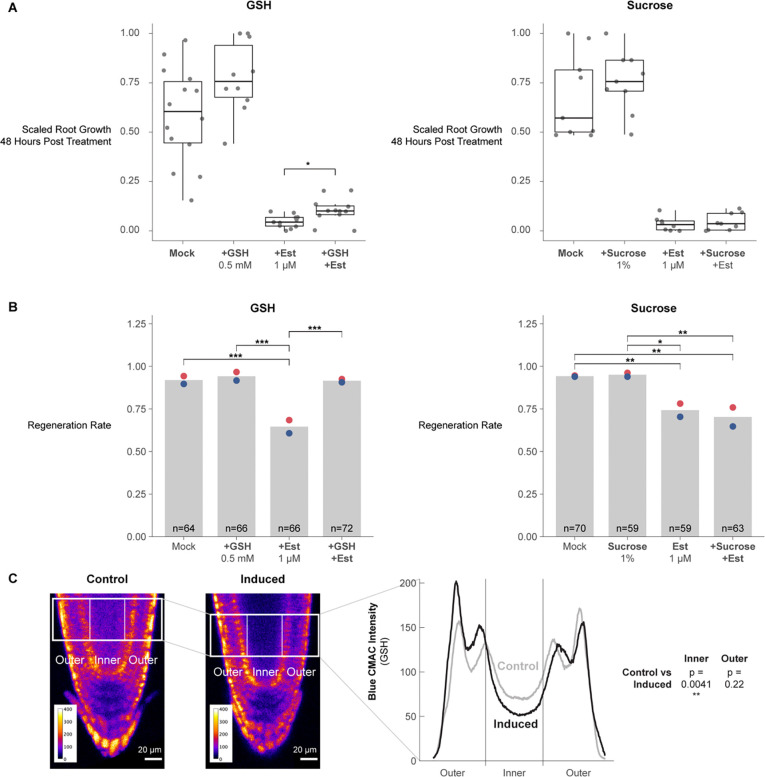
Figure 7: The ground tissue is an apparent source of GSH in homeostatic growth and regeneration.
(A) Root growth (y-axis) post callose-synthase induction for each treatment condition (x-axis). Root lengths are scaled to their own controls within technical replicates from 0 to 1 to render them comparable across batches. Statistical significance was determined by the pairwise Wilcoxon test comparing estradiol or non-estradiol categories (i.e. mock was tested versus GSH and estradiol was tested versus estradiol + GSH) (n > 10 roots per condition, p-value = 0.02 by the Wilcoxon test). Each dot represents an individual root. (B) At left, regeneration rates (y-axis) based on the gravitropism test at 48 hpc. The conditions (x-axis) are control (mock), GSH treated roots (+GSH), estradiol-treated roots (+Est, induction of callose synthase expression to block transport out of the cortex and endodermis), estradiol + GSH treated roots (+GSH,+Est). At right, the same treatments substituting 1 μM sucrose for GSH. Red and blue dots represent the regeneration rates of technical replicates (***<0.00071, **<0.0003, *<0.004,Fisher’s exact test). (C) In the left panel, representative confocal microscopy images of GSH staining using Blue CMAC for uninduced control (left) and ground tissue callose-synthase induced (right) roots are shown. ROIs on the images show representative examples of ROIs used to calculate Blue CMAC intensity on the right panel across inner and outer files. The y-axis on the right panel represents the average intensity for each column of pixels of several comparable ROIs (n=21) across the x dimension of the ROI. Average intensities for inner versus outer ROIs were tested for significant difference with, with a significant difference only in the inner cell files (p=0.0041, pairwise t test).

