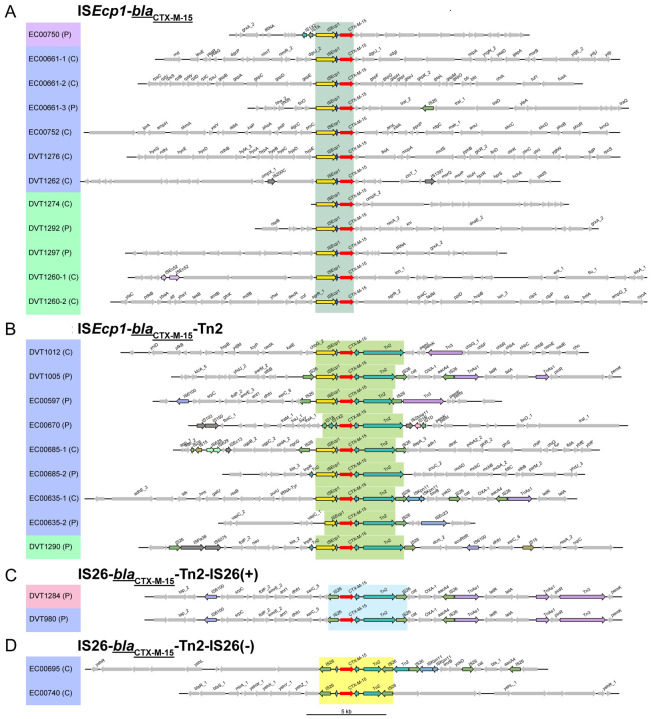
Figure 5. Regions flanking blaCTX-M-15 among ST131 E. coli isolates.
(A-D) Genomic context of different blaCTX-M-15-carrying MGEs is shown. Isolate names are shaded based on their phylogenetic clade assignments (clade A=purple; subclade C2=blue; subclade C1=green; subgroup C2a=pink). The genomic location of each sequence is indicated (C=chromosome, P=plasmid) and blaCTX-M-15 genes are colored red. Genes were annotated with Prokka, and genes with predicted functions are labeled. Genes associated with MGEs and transposases are highlighted with black outlines, and are colored if found in more than one region. Regions that were used for MGE classification are shaded in each panel.

