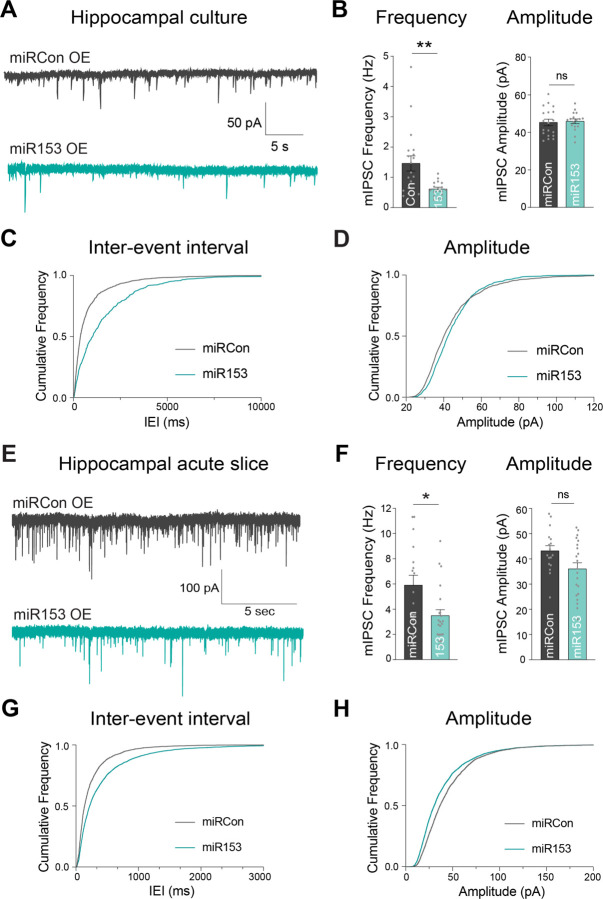
Figure 3. miR153 overexpression impacts GABAergic synaptic transmission.
(A) Representative mIPSC current traces from miRCon and miR153 OE-expressing neurons in hippocampal culture.
(B) Quantification of mIPSC frequency (left) and amplitude (right) from miRCon and miR153 OE-expressing neurons. n = 17–19 neurons per condition.
(C) Cumulative frequency distribution of mIPSC inter-event intervals (IEI) for events in miRCon and miR153 OE-expressing neurons.
(D) Cumulative frequency distribution of mIPSC amplitude for events in miRCon and miR153 OE-expressing neurons.
(E) Representative traces recorded from miRCon and miR153 OE-expressing neurons in acute hippocampal slices.
(F) Quantification of mIPSC frequency (left) and amplitude (right) from miRCon and miR153 OE-expressing neurons. n = 17–22 neurons per condition.
(G) Cumulative frequency distribution of mIPSC IEI for events in miRCon and miR153 OE-expressing neurons.
(H) Cumulative frequency distribution of mIPSC amplitude for events in miRCon and miR153 OE-expressing neurons.
All values represent mean ± SEM. *p<0.05 and **p<0.01, ***p<0.005, ****p<0.0001; Mann-Whitney test.

