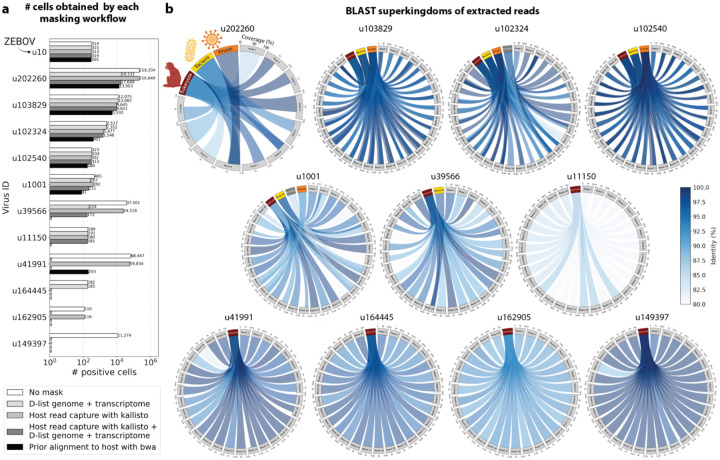
Fig. 5:
a, The number of positive cells obtained for 12 different virus IDs by each masking workflow. Each masking workflow is described in detail in the Methods section. The cell counts for all viruses detected above the QC threshold for all masking workflows are shown in Extended Data Fig. 5. b, pyCirclize plots showing the BLAST+55,56 results of randomly selected sequencing reads for each of the novel viruses shown in a (excluding the known virus ZEBOV which corresponds to virus ID ‘u10’). Each circular plot corresponds to the results for one virus ID. Each light grey sector corresponds to one sequencing read that links to the superkingdoms (red (eukaryotes), yellow (bacteria), orange (viruses), and dark grey (archaea) sectors) based on its BLAST+ alignment results. The width of the connecting link indicates the BLAST+ alignment coverage percentage, and its color indicates the identity percentage. For u202260, approximately ⅔ of the extracted reads yielded no BLAST results.

