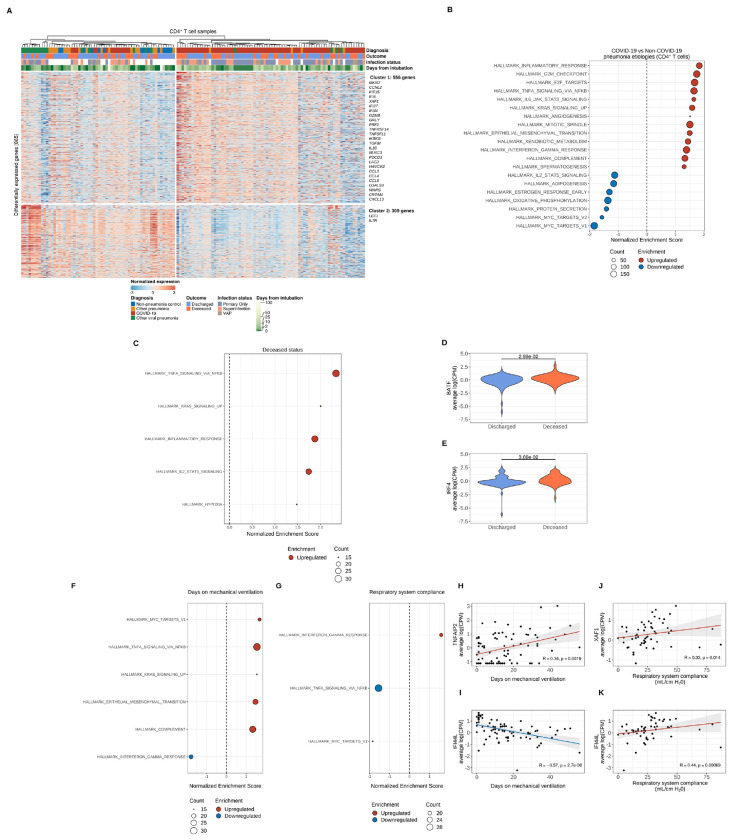
Figure 3. Transcriptional profiling of alveolar CD4+ T cells reveals distinct effector activation signatures that are associated with clinical outcomes that shift throughout the course of severe SARS-CoV-2 pneumonia.
(A) K-means clustering of 865 differentially expressed genes (q < 0.05, likelihood-ratio test with FDR correction) across pneumonia diagnoses. Columns represent unique samples and column headers are color-coded by diagnosis, binary outcome (whether a given patient was discharged from the hospital alive or died during hospitalization), duration of mechanical ventilation (blanks indicate chronically ventilated patients), and infection status (presence or absence of bacterial superinfection in patients with COVID-19 or other viral pneumonia). The VAP (ventilator-associated pneumonia) flag designates samples from non-pneumonia controls or patients with COVID-19 or other viral pneumonia who cleared the virus and then developed a bacterial pneumonia. Samples were clustered using Ward’s minimum variance clustering method. Representative genes are shown for each cluster. (B) Gene set enrichment analysis (GSEA) of Hallmark gene sets for the pairwise comparison between COVID-19 samples and combined non-COVID-19 samples (non-pneumonia control, other pneumonia and other viral pneumonia). Count denotes pathway size after removing genes that were not detected. Enrichment denotes significant (q < 0.25 with FDR correction) upregulated (red) and downregulated (blue) pathways by normalized enrichment score. (C) GSEA of COVID-19 samples after performing correlation analysis of differentially expressed genes in CD4+ T cells and the binary outcome variable with Spearman rank correlation coefficient computation. Count denotes pathway size after removing genes not present in expression dataset. Enrichment denotes significant (q < 0.25 with FDR correction) upregulated (red) and downregulated (blue) pathways by normalized enrichment score. (D-E) Leading edge analysis reveals selected core genes driving pathway enrichment signal in the binary outcome variable. (F-G) GSEA of COVID-19 samples after performing correlation analysis of differentially expressed genes in CD4+ T cells and the duration of mechanical ventilation variable (F) and respiratory system compliance variable (G) with Spearman rank correlation coefficient computation. Count denotes pathway size after removing genes not present in expression dataset. Enrichment denotes significant (q < 0.25 with FDR correction) upregulated (red) and downregulated (blue) pathways by normalized enrichment score. (H-I) Leading edge analysis reveals selected core genes driving pathway enrichment signal in the duration of mechanical ventilation variable. (J-K) Leading edge analysis reveals selected core genes driving pathway enrichment signal in the respiratory system compliance variable.

