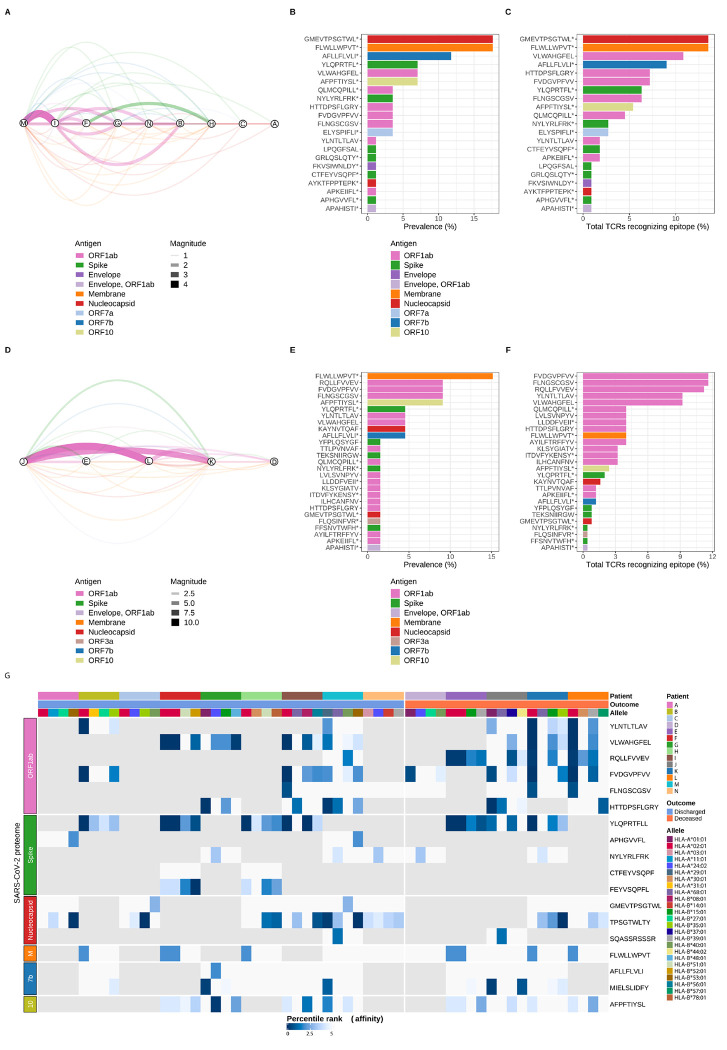
Figure 5. SARS-CoV-2 epitope mapping reveals a distinctive landscape of peptide immunodominance and immunoprevalence associated with outcomes in patients with COVID-19.
(A) Network analysis of shared TCR sequences from CD8+ T cells recognizing SARS-CoV-2 epitopes. Nodes represent the nine unique patients with COVID-19 who survived hospital discharge (labeled here using the lettering scheme from Figure 4G), edges constitute shared TCR sequences by at least two patients mapped to a MIRA class I dataset epitope pool, and width of edges (magnitude) denotes total number of shared TCR sequences. Edges are color-coded by SARS-CoV-2 antigens. (B) Immunoprevalence of SARS-CoV-2 epitopes in discharged patients was calculated by counting the number of events when a given epitope was shared by at least two patients. Total counts from all 21 identified epitopes are represented as percentage (%) of TCRs recognizing a given epitope. (C) Overall number of TCR sequences mapped to a given SARS-CoV-2 epitope in discharged patients was calculated by counting all events of TCRs recognizing an epitope. Total counts from all 21 identified epitopes are represented as percentage (%). (D) Network analysis of shared TCR sequences recognizing SARS-CoV-2 epitopes in the five unique patients with COVID-19 who died during hospitalization (labeled here using the lettering scheme from Figure 4G), edges constitute shared TCR sequences by at least two patients mapped to a MIRA class I dataset epitope pool, and width of edges (magnitude) denotes total number of shared TCR sequences. Edges are color-coded by SARS-CoV-2 antigens. (E) Immunoprevalence of SARS-CoV-2 epitopes in deceased patients was calculated by counting the number of events when a given epitope was shared by at least two patients. Total counts from all 27 identified epitopes are represented as percentage (%). (F) Overall number of TCR sequences mapped to a given SARS-CoV-2 epitope in deceased patients was calculated by counting all events of TCRs recognizing an epitope. Total counts from all 27 identified epitopes are represented as percentage (%). (G) Heatmap of predicted SARS-CoV-2 epitope binding affinity to patient-specific HLA molecules grouped by unique patient, binary outcome, HLA alleles, and SARS-CoV-2 antigens. Percentile rank denotes predicted affinity strength with percentile ranks <1% and <5% denote strong and weak MHC binder sequences, respectively. Gray tiles represent epitopes not detected within a given patient. Column labels are color-coded by patient, binary outcome, and HLA alleles. Row labels are color-coded by SARS-CoV-2 antigens. M (Membrane), 7b (ORF7b), 10 (OFR10), * denotes other epitopes are present within MIRA class I dataset peptide pool.

