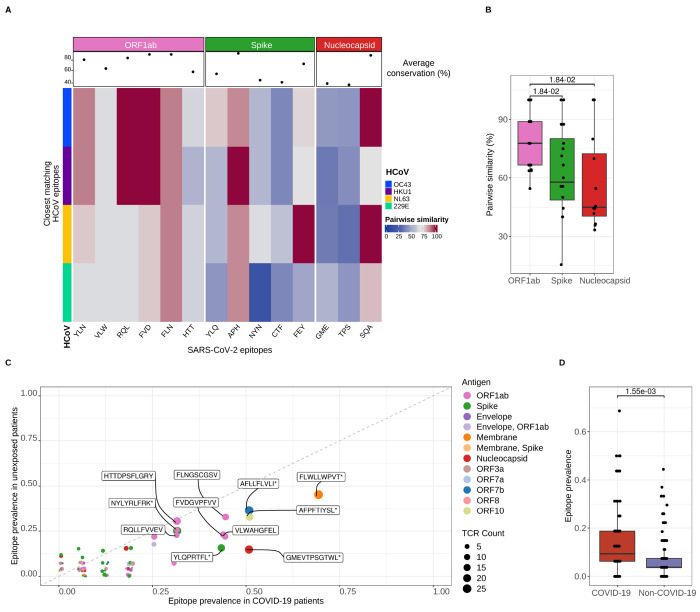
Figure 6. Predicted alveolar CD8+ T cell receptor targets cross-react with other human coronaviruses.
(A) Heatmap of conserved sequence similarity between dominant SARS-CoV-2 epitopes detected in alveolar CD8+ T cells and human coronaviruses (HCoV). Columns represent SARS-CoV-2 epitopes grouped and color-coded by antigen region. Rows are color-coded by distinct HCoV. Pairwise similarity denotes percentage of sequence homology between viruses. An average sequence homology percentage across all HCoV for each SARS-CoV-2 epitope is depicted as a dot in the column header. (B) Pairwise sequence similarity scores between SARS-CoV-2 epitopes and closest matching epitopes from human coronaviruses. q < 0.05, pairwise Wilcoxon rank-sum tests with FDR correction. (C) Scatter plot of SARS-CoV-2 epitope prevalence of CD8+ T cells in patients with COVID-19 (n = 14) and without COVID-19 (unexposed, n = non-pneumonia control [4], other pneumonia [7], and other viral pneumonia [8]). Dots are color coded by SARS-CoV-2 antigen. Dot size corresponds to the number of detected TCR sequences recognizing a given antigen. Random variation to location of points was added with geom_jitter function from ggplot2 v.3.4.4 for improved visualization. (D) SARS-CoV-2 epitope prevalence in overall patient cohort from bulk CD8+ TCR sequencing grouped by COVID-19 status (n of patients = non-pneumonia control [4], other pneumonia [7], COVID-19 [14] and other viral pneumonia [8]). Wilcoxon rank sum test, p < 0.05.

