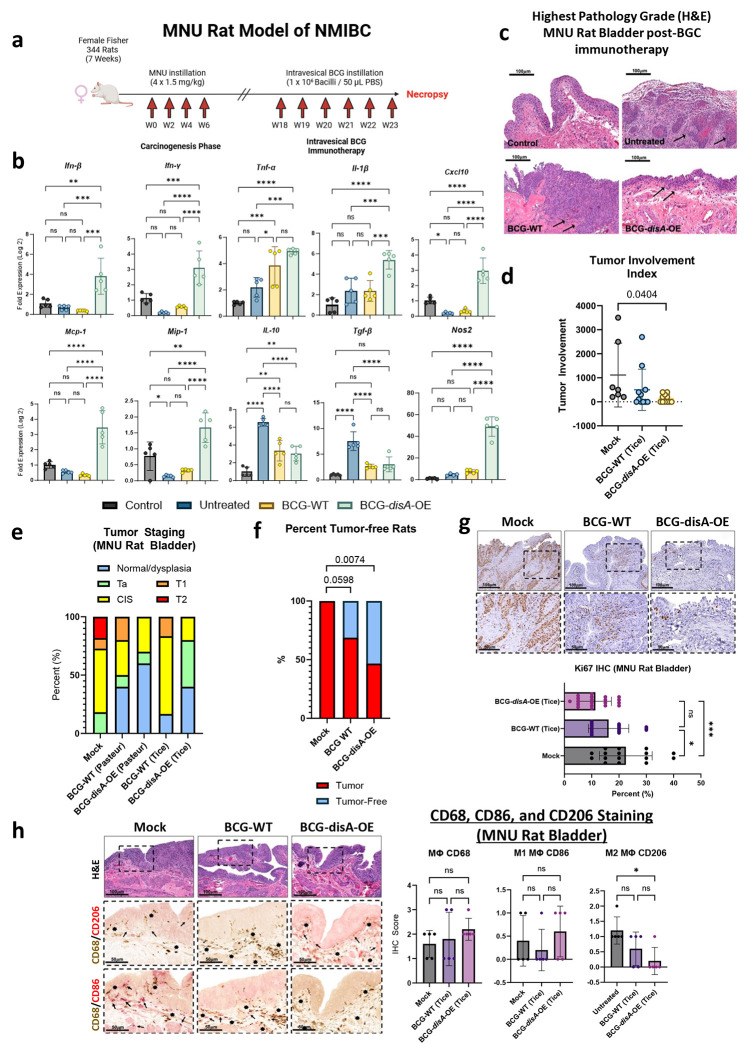
Figure 2. BCG-disA-OE elicits improved antitumor efficacy over BCG-WT in an orthotopic carcinogen-induced MNU rat model of urothelial cancer.
a. Schematic diagram of the MNU rat model of NMIBC. b. mRNA levels for proinflammatory cytokines (IFN-β, IFN-γ, TNF-α, IL-1β), regulatory chemokines (CXCL10, Mcp-1, MIP-1α), immunosuppressive M2-like macrophage cytokines (IL-10, TGF-β), and the M1-like tumoricidal effector (Nos2) in whole bladders at necropsy (wk 23) measured by RT-qPCR relative to GAPDH (n= 5 animals / group). c. Representative H & E staining showing highest pathology grade for each group (control, untreated MNU bladder). d. Tumor involvement values at necropsy e. Tumor stage at necropsy. f. Percent of rats which were cancer-free at necropsy; BCG-WT (Pasteur and Tice), and BCG-disA-OE (Pasteur and Tice). g. Representative immunohistochemistry and bar graph of rat bladder tissue at necropsy stained for Ki67. h. Representative immunohistochemical co-staining and graph for CD68 (brown), CD86 (M1-like macrophages; red) and CD206 (M2-like macrophages; red) in rat bladder tissues at necropsy. Tumor staging and involvement index was performed by a pathologist trained urothelial cancers who was blinded to sample identities. The MNU model was conducted twice with BCG strains from the Tice background and the Pasteur background. Data shown represent pooled results from the two studies (n = 11-16 animals per group). Data are represented as mean values ± S.D. Statistical analyses were done using one-way ANOVA with Tukey’s test for multiple comparisons in panels b, g, & h; one-way ANOVA with Dunnett’s Test for multiple comparisons in panel d; two-sided Fisher’s Exact test in panel f (* p < 0.05, ** p < 0.01, *** p < 0.001, ****p < 0.0001).

