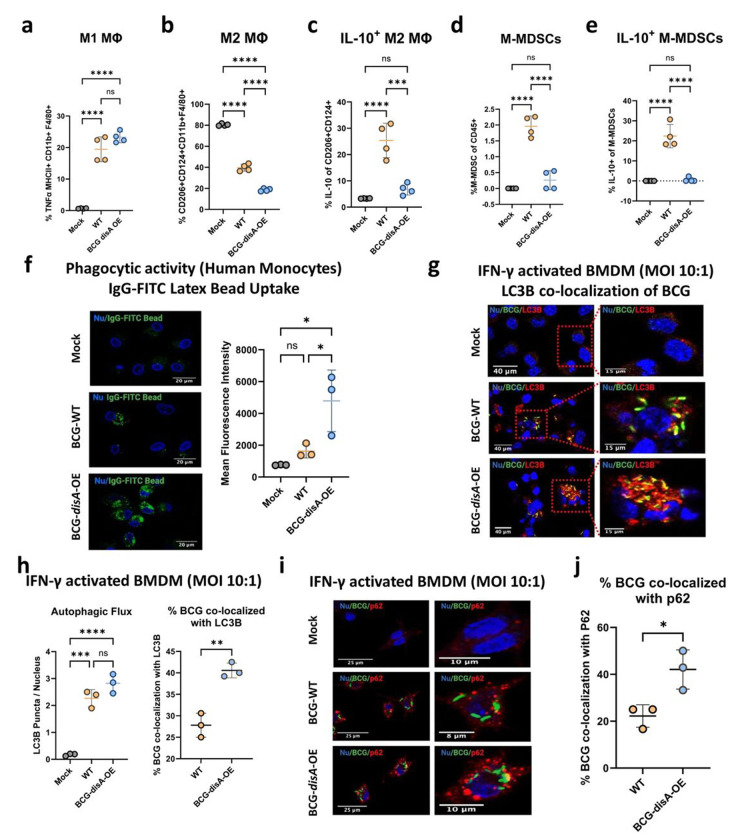
Figure 6.
BCG-disA-OE elicits greater macrophage re-programming, phagocytic activity, and autophagy than BCG-WT in human and murine macrophages. Percentages of cells arising from primary murine macrophages exposed to BCG (Tice) strains at an MOI of 20:1 at 24 hours post-exposure: a. M1-like macrophages (TNFα-expressing of MHCII+ CD11b+ F4/80+ cells), b. M2-like macrophages (CD206−, CD124-expressing of CD11b+ F4/80+ cells), c. IL-10 expressing M2-like macrophages (IL-10 expressing of M2-like macrophages), d. monocytic myeloid-derived macrophages (M-MDSCs, Ly6Chi, Ly6G- of CD11b+ F4/80+ cells), e. IL-10 expressing M-MDSCs (IL-10-expressing of M-MDSCs) (FigS9b). Flow cytometry studies shown are for BCG strains in the Pasteur background. Data are presented as mean values ± SD (n = 3 biological replicates). Gating schemes and data acquisition examples are shown in Fig. S6–S9. f. Phagocytic activity in human primary macrophages in representative confocal photomicrographs showing intracellular uptake of FITC-labeled IgG-opsonized latex beads (green) with nuclei stained blue. g. Autophagy induction measured by LC3B puncta co-localization with BCG strains, and h. quantification of BCG-LC3B co-localization in primary murine macrophages shown by representative confocal photomicrographs. i. Autophagy induction measured by p62 puncta co-localization with BCG strains and p62, and j. quantification of BCG-p62 co-localization. FITC-labeled BCG strains are stained green, LC3B or p62 autophagic puncta (red), nuclei blue, and co-localization (yellow). Cells were fixed using 4% paraformaldehyde 6 h after infection (MOI 10:1), and images obtained with an LSM700 confocal microscope and Fiji software processing. Quantification was measured by mean fluorescence intensity. Co-localization studies shown are for BCG strains in the Tice background. Data shown for the confocal microscopy studies are mean values ± SD (n= 3 biological replicates). Statistical analyses done using one-way ANOVA w/Tukey’s multiple comparisons test in panels a-f, & h; 2-tailed Student’s t-test in panels h and j (* p < 0.05, ** p < 0.01, *** p < 0.001, **** p < 0.0001).

