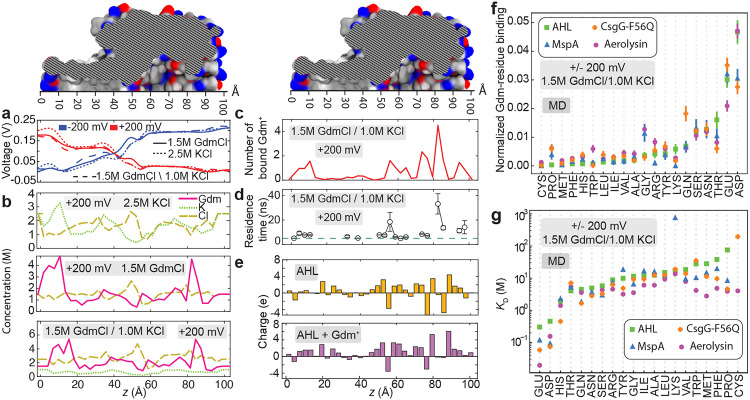
Figure 4: Guanidinium binds to nanopore surface and renders it positively charged.
a, Average electrostatic potential along the axis of the α-hemolysin nanopore (the z-axis) for the three electrolyte conditions and at ±200 mV transmembrane bias. b, Local concentration of ions along the transmembrane nanopore of α-hemolysin observed in all-atom MD simulations under +200 mV and 2.5 M KCl (top), 1.5 M GdmCl (middle) and 1.5 M GdmCl / 1.0 M KCl (bottom) electrolytes. The concentrations were averaged over the respective MD trajectories in 3 Å bin along the nanopore axis. c, Number of Gdm+ ions bound to the inner surface of the α-hemolysin nanopore, averaged over the simulation time. A Gdm+ ion was considered bound if any of its non-hydrogen atoms was located within 3 Å of any non-hydrogen atom of the nanopore. d, Average residence time of the Gdm+ ions bound to the α-hemolysin surface as a function of their location within the nanopore. Contacts between Gdm+ and α-hemolysin lasting less than 5 ns (dashed green line) were discarded from the residence time analysis. e, Local charge of the inner surface of the α-hemolysin nanopore (top) and the total charge of that surface when taking into account bound Gdm+ ions (bottom). f, Number of solvent-exposed residues of the specified type that bind Gdm+ normalized to the total number of such residues for the four biological nanopores. Error bars show the standard error computed using 30 ns fragments of the simulation trajectories. g, Dissociation constant (KD) computed for each type of amino acids in four different nanopores. Note the logarithmic scale of the KD axis. In panels f and g, amino acid types are arranged in ascending order according to α-hemolysin data.

