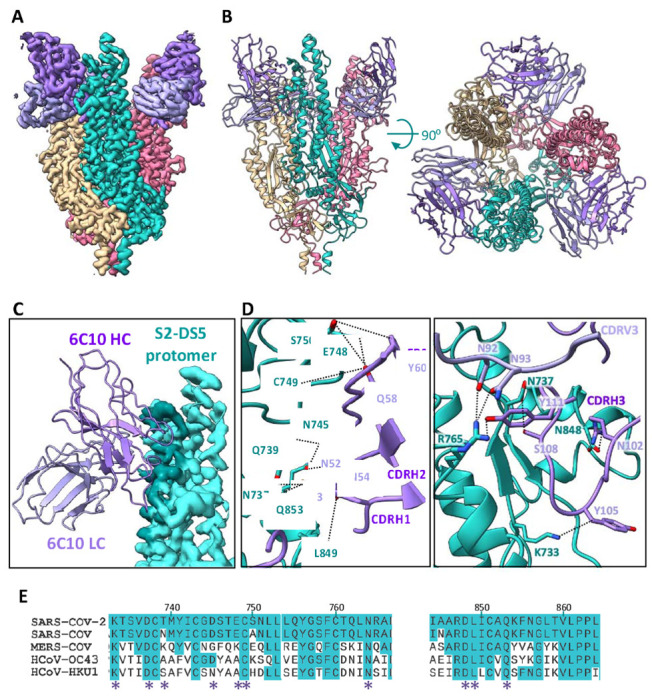
Figure 4. Cryo-EM analysis of the 6C10Fab/S2-DS5 interaction and relative conservation of epitope contact residues.

(A) Side view of the cryo-EM density map of S2-DS5 ectodomain in complex with Fab 6C10. S2-DS5 is colored as in Figure 3, and the 6C10 Fab density is colored dark purple (heavy chain) and light purple (light chain). (B) Side (left) and top (right) views of the 6C10Fab/S2-DS5 molecular model complex, colored as in (A). (C) Zoom of the footprint of one 6C10 Fab to one S2-DS5 protomer. The 6C10 Fab is shown as ribbon representation and the S2-DS5 as the cryo-EM density. The footprint is colored darker than the rest of the S2. (D) S2-DS5 interactions with 6C10. The left panel shows a close-up view of interactions made by 6C10 CDRH1, H2, and framework region 2. Right panel shows the 6C10 CDRH3 interactions and the interaction of the 6C10 light chain (N92 and N93) with the residue R765 of S2-DS5. (E) Sequence alignment of the 6C10 conformational epitope (spike region 733-765 and loop 833-856) from the five human-infective beta-coronaviruses. Similarity in conservation with SARS-CoV-2 is shown in turquoise, and the interaction positions with the Fab are marked with a purple asterisk.
