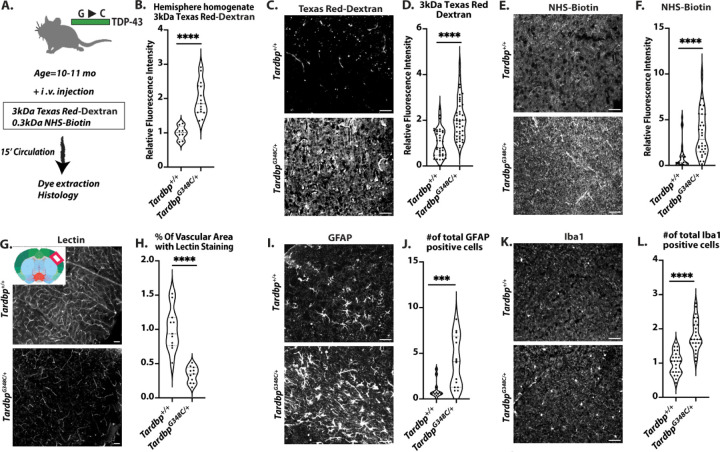
Figure 1. Blood brain barrier disruption and vascular sequelae in TardbpG348C/+ mice.
(A) A schematic illustration of the assay for measuring BBB permeability is presented in Figure A. (B) The quantification process involved homogenizing brain tissue samples from 10–11month-old wild-type Tardbp+/+ mice (n=8) and their heterozygous littermates, TardbpG348C/+ mice (n=15), followed by measuring fluorescence intensity at 590 nm. Representative images of (C) 3kDa Texas Red-dextran leakage, (E) NHS-Biotin, (G) Tomato-lectin perfusion, (I) GFAP staining of astrocytes and (K) Iba1 staining of microglia in the mouse brain cortex reveal consistent results across Tardbp+/+ mice (n=3) and TardbpG348C/+ mice (n=3). (D, F, H) Quantification of data, with each data point representing the fluorescence image intensity in one image. (J, L) Quantification of data with each data point representing the number of activated cells in an image. multiple images per mouse. Scale bars, 50 μm. Data are presented as means ± SEM. Statistical analysis was conducted using an unpaired Mann Whitney test, with significance levels indicated as follows: ***P 0.0001, ****P<0.0001.

