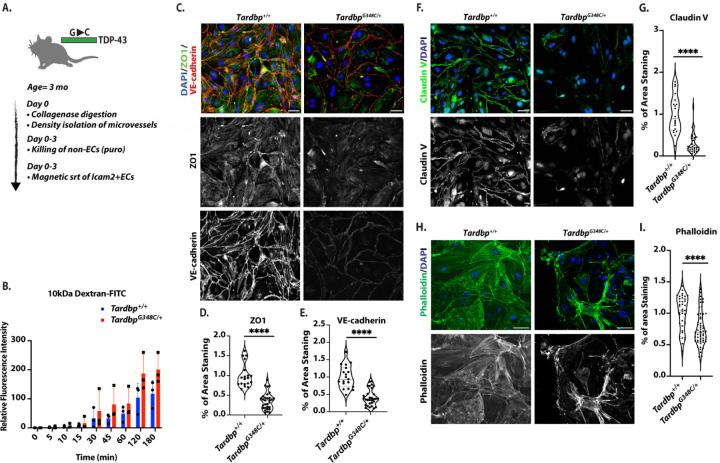
Figure 2. Endothelial cells isolated from TardbpG348C/+ mice exhibited decreased levels of cell junction proteins, altered actin organization, and increased permeability.
(A) Schematic illustration of the isolation and purification of ECs. (B) Passage of 10kDa FITC-Dextran dye across confluent monolayers of endothelial cells isolated from Tardbp+/+ (n=3) and TardbpG348C/+ (n=3). Statistical analysis was conducted using linear regression, ****P ≤ 0.0001. (C, F, H) Representative images of mouse brain endothelial cells isolated from 3-month-old wild-type Tardbp+/+ (n=6) and their heterozygous littermates, TardbpG348C/+ mice (n=6), immunostained with antibodies to the indicated proteins. (D, G, I) Quantification of data, with each data point representing the fluorescence image intensity in one image, multiple images taken of cells from each mouse. Scale bars: 50 μm. Data are presented as means ± SEM. Data are presented as means ± SEM. Statistical analysis was conducted using an unpaired Mann Whitney test, with significance levels indicated as follows: ****P ≤ 0.0001.

