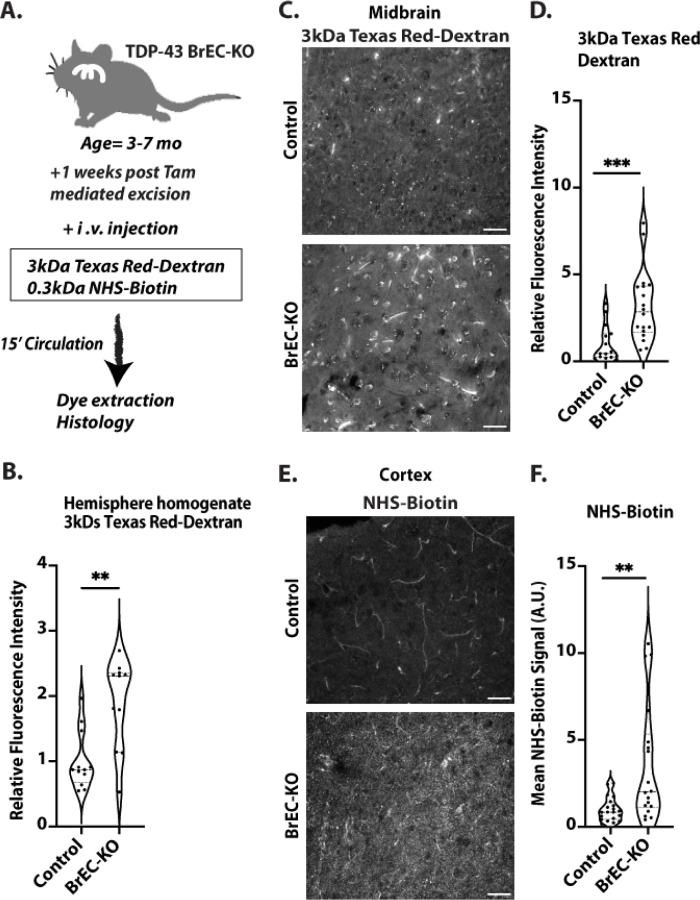
Figure 5. Blood brain barrier disruption in Tardbp BrEC-KO mice.
(A) Schematic representation of the assay for measuring blood-brain barrier (BBB) permeability. (B) Measurement of 3kDa Texas Red-Dextran in homogenized brain tissue one week after Tamoxifen treatment of BrEC-KO mice (n=11) and littermate controls (n=12). **P<0.0034. (C&E) Representative images of (C) 3kDa Texas Red-Dextran leakage and (E) NHS-biotin in the cortex of 3–7-month-old mice (n=3 BrEC-KO and n=3 littermate controls). (D&F) Quantification signal, with each data point representing the fluorescence image intensity from one image, multiple images per mouse. Scale bars, 50 μm. Data are presented as means ± SEM. Statistical analysis was conducted using an unpaired Mann Whitney test, with significance levels indicated as follows: **P<0.0019, ***P<0.0002.

