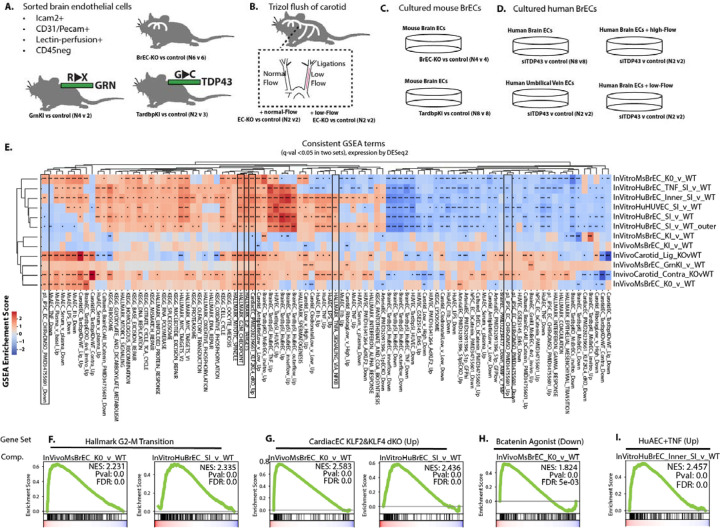
Figure 6. Consistent perturbations of transcriptional levels indicates core pathways targeted by partial or complete loss of nuclear TDP-43.
(A-C) Outline of approach, indicating the biological replicates of each condition. (A) Shows conditions from which brain endothelial cells were sorted by flow cytometry. (B) Shows isolation procedure from carotid artery with disturbed flow. (C) Shows in vitro conditions, using primary human brain endothelial cells or purified endothelial cells isolated from BrEC-KO or KI mice. Additional details on the samples used for RNA isolation and transcriptional analysis are contained in the methods. (E) Heat map and clustering (UPGMA algorithm) of the most consistently affected KEGG and Hallmark pathways (human to mouse liftover by Biomart). Other datasets including show the top 200 transcripts up or down regulated, by p-value and after setting expression level cutoff, from a range of datasets in the literature or the lab. (F-L) Example GSEA plots for top scoring pathways. FDR value derived from GSEA analysis is shown, ***P<0.001, **P<0.01, *P<0.05.

