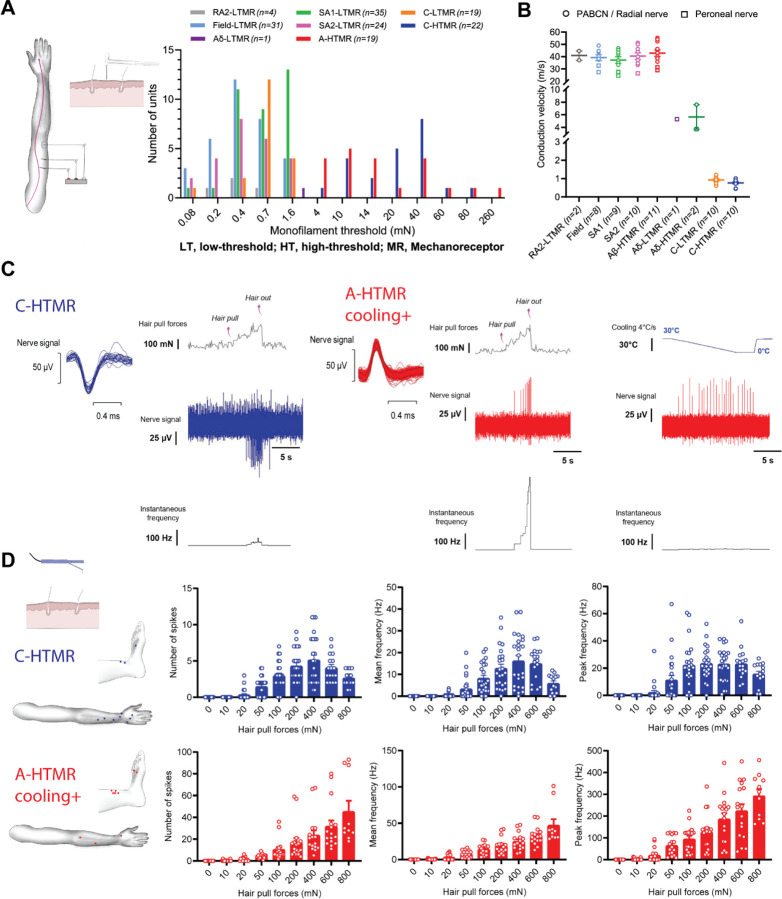
Figure 2: Specialized A-fiber nociceptors encode hair-pull pain.
A. Mechanical threshold distribution of HTMRs and LTMRs in the recorded sample. For RA1 afferents, the preferred stimulus is hair movement, so monofilament thresholds were not measured. B. Conduction velocities of HTMRs and LTMRs in response to surface electrical stimulation and/or mechanical stimulation using an electronic monofilament with force-feedback. Conduction velocities of Aβ-HTMRs (42.8 ± 8.9 m/s, n=11) were statistically indistinguishable from Aβ-LTMRs ([SA1]: 37.2 ± 7.8 m/s, q=2.74, p=0.5318, n=9; [SA2]: 40.4 ± 8.3 m/s, q=1.21, p=0.9890, n=10; [Field]: 39.2 ± 6.9 m/s, q=1.726, p=0.922, n=8). Statistical differences were assessed using a one-way ANOVA with Tukey’s multiple comparisons test. Data are shown as individual and mean (±SEM) responses. PABCN, posterior antebrachial cutaneous nerve. C. Representative traces displaying hair-pull responses of a C-HTMR and a cooling-responsive A-HTMR. Single hairs were pulled from the receptive field of the recorded afferent until the hair was extracted. D. Receptive field locations of C-HTMRs (n=11) and cooling-responsive A-HTMRs (n=10) with hair present in the receptive field for hair-pull testing (left). The data show the individual trials and mean (±SEM) responses of C-HTMRs and cooling+ A-HTMRs to hair pulling at different forces. For C-HTMRs, hair pulling forces had a significant effect on the number of spikes (F(8,190) = 29.36, p<0.0001), as well as on mean (F(8,190) = 20.21, p<0.0001) and peak frequencies (F(8,190) = 20.81, p<0.0001). The response of C-HTMRs to increasing pull forces plateaued or dropped with further increases in pull forces. Accordingly, the peak frequency at the highest pulling force of 800 mN was not significantly different from other forces tested (p>0.05). For cooling+ A-HTMRs, hair pulling forces also had a significant effect on the number of spikes (F(8,135) = 17.39, p<0.0001), as well as on mean (F(8,135) = 31.34, p<0.0001) and peak frequencies (F(8,135) = 28.19, p<0.0001). However, in contrast to C-HTMRs, the activity in A-HTMRs was tuned to increasing hair-pull forces with the most robust response observed at the highest pulling force. Accordingly, the peak frequency at the highest pulling force of 800 mN was significantly higher than all other forces tested (at least p<0.001). Statistical differences were assessed by a one-way ANOVA with Tukey’s multiple comparisons test. The mechanical threshold, conduction velocity (where tested), and cooling response of five A-HTMRs from this sample were published in a preprint4.

