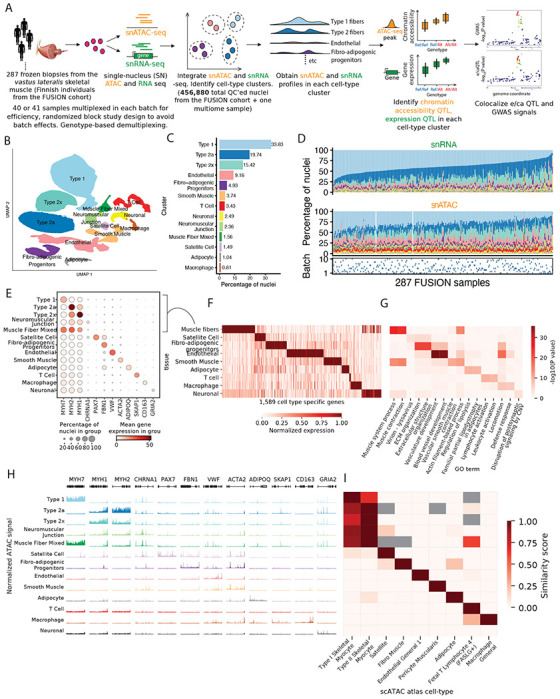
Figure 1: snRNA and snATAC -seq data generation and integration identifies 13 high quality cell-type clusters.

(A) Study design including sample processing, snRNA and snATAC -seq profiling, and analyses. (B) UMAP plot showing the 13 identified clusters after jointly clustering the snRNA and snATAC modalities. (C) Cluster abundance shown as percentage of total nuclei. (D) Cluster proportions across samples and modalities. (E) Gene expression (post ambient-RNA adjustment) in clusters for known marker genes for various cell-types. (F) Identification of cell-type-specific genes across clusters. Five related muscle fiber clusters (type 1, 2a, 2x, neuromuscular junction and muscle fiber mixed were taken together as a”muscle fiber” cell type). (G) GO term enrichment for cell-type-specific genes identified in (F), showing two GO terms for each cluster. (H) snATAC-seq profiles over known marker genes in clusters. (I) Comparison of snATAC-seq peaks identified for clusters in this study with reference data across various cell-types from the K. Zhang et al. (2021) scATAC-seq atlas.
