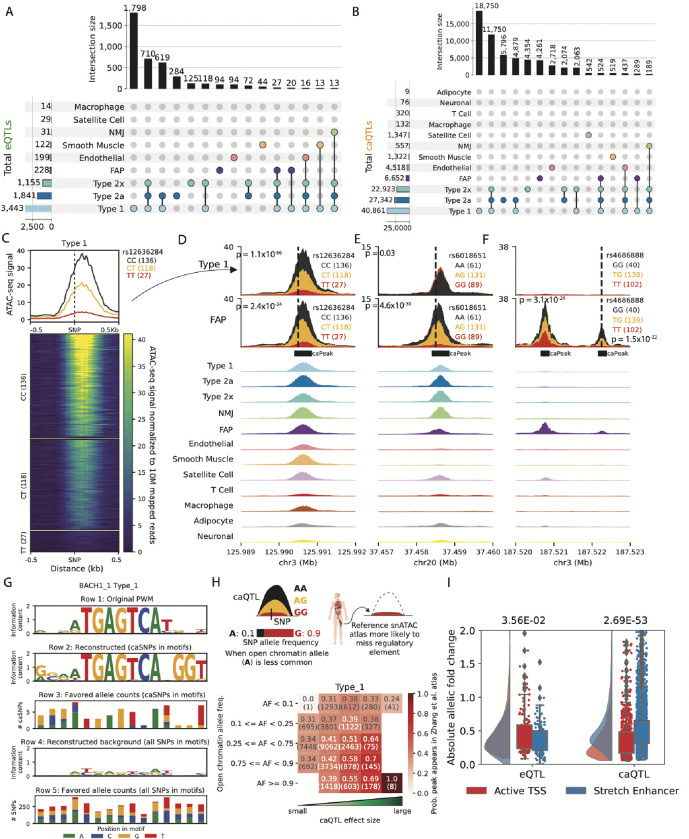
Figure 2: Thousands of e/caQTLs identified in clusters.
(A) UpSet plot showing eGenes, and (B) caPeaks in clusters (FDR<5%) (C) An example caQTL. Heatmap shows normalized snATAC-seq reads across samples in the type 1 cluster, separated by caSNP rs12336284 genotype classes. Aggregate profiles by genotype are shown on top. Examples of shared and cluster-specific caQTL are shown in (D) , (E) , and (F) . Top two rows show snATAC-seq profiles by the caSNP genotype in type 1 and FAP cell types, followed by aggregate snATAC profiles across clusters. (G) Reconstruction of the BACH_1 TF motif using caQTL data. From top, row 1: original motif PWM. Row 2: genetically reconstructed motif PWM. For all BACH_1 motifs occurring in type 1 snATAC-seq peaks (peak-motifs) that also overlapped type 1 caSNPs, alleles associated with higher chromatin accessibility (“favored alleles”) were quantified using the caQTL aFC, followed by PWM generation. Row 3: favored allele counts for caSNPs in BACH_1 peak-motifs. Row 4: PWM reconstructed using the nucleotide counts for all heterozygous SNPs overlapping the BACH_1 peak-motifs. Row 5: nucleotide counts for all heterozygous SNPs in the BACH_1 peak-motifs. (H) Comparison of caSNP effect size and MAF with the replication of snATAC-seq peaks in a reference scATAC dataset42. (I) Allelic fold change for type 1 e/caSNPs that overlap skeletal muscle active TSS or stretch enhancer chromatin states. P values from a two-sided Wilcoxon rank sum test.

