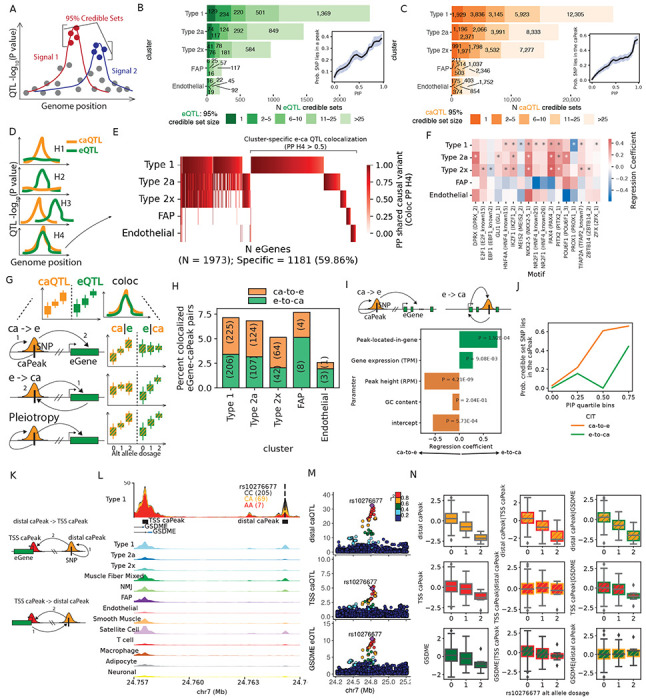
Figure 3: e/ca QTL finemapping, colocalization and causal inference informs regulatory grammar in clusters.

(A) Identification of independent signals and finemapping was performed using SuSiE for e,caQTL. (B) Number of eQTL signals and (C) caQTL signals classified by the number of variants in the finemapped 95% credible set. Insets show the probability of a eSNP overlapping a peak in (B) and caSNP overlapping the caPeak in (C) in a cluster relative to the PIP. (D) Testing for colocalization between e and ca QTL signals informs if the modalities share common causal variant(s). (E) Heatmap showing the posterior probability of shared causal variant (PP H4) from coloc for pairs of eGenes and caPeaks in the five clusters. (F) TF motif enrichment in caPeaks that colocalize with eGenes. “*” denotes significant logistic regression coefficient (5% FDR). (G) After identifying colocalizing e-and-ca QTL signals, causal inference tests (CIT) can inform the causal direction between the gene expression and chromatin accessibility modalities using e/ca SNPs as instrument variables. (H) (I) (J) (K) (L) (M) (N) continued on the next page. (H) Percentage of colocalizing eGene-caPeak pairs for which the putative causal direction could be determined (5% FDR) as chromatin accessibility over gene expression (ca-to-e) or vice versa from CIT. (I) Logistic regression modeling the causal direction between caPeak-eGene pairs with whether the caPeak lies within the eGene body, along with eGene expression (TPM,) caPeak height (RPM), and GC content. (J) Probability that a caSNP lies in the caPeak relative to caSNP PIP (binned into quartiles), classified by if the caPeak was inferred as ca-to-e or e-to-ca from CIT. (K) For colocalized caPeak and eGene pairs where a caPeak was also identified in the TSS+1kb upstream region of the eGene, causal direction can be estimated between the distal-caPeak and the TSS-caPeak. (L) Type 1 snATAC-seq signal track by rs10276677 genotype classes over the GDSME locus on chr7 showing a distal-caPeak, a TSS-caPeak and the GDSME gene TSS. Aggregate snATAC-seq in clusters are shown below. (M) Locus-zoom plots showing the distal-caQTL, TSS-caQTL and the GDSME eQTL. (N) Causal inference between the distal-caPeak, TSS-caPeak and the GDSME gene using rs10276677 as the instrument variable. Boxplots show inverse normalized chromatin accessibility or gene expression relative to the alternate allele dosages at rs10276677 before and after regressing out the corresponding modality.
