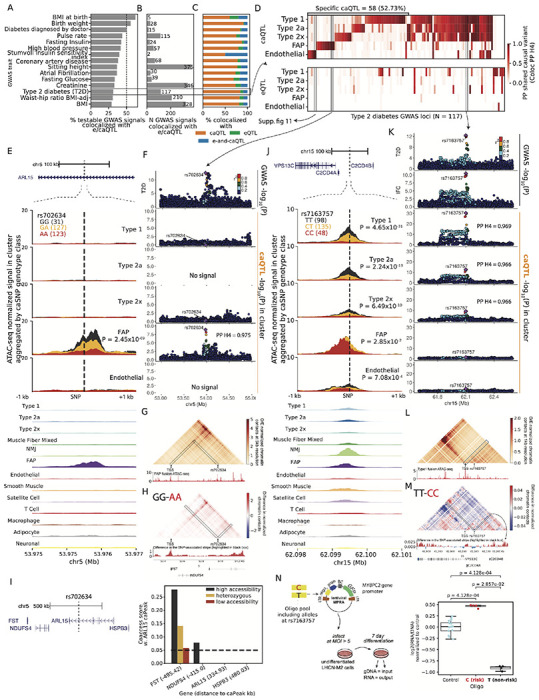
Figure 5: Integrating e,ca QTL signals with GWAS inform disease/trait relevant regulatory mechanisms.

(A) Percentage of testable GWAS signals, and (B) Number of GWAS signals across traits that colocalize with e/ca QTL signals across the five clusters. (C) Proportion of colocalized GWAS signals (from B) that colocalize with only caQTL or only eQTL or both e-and-caQTL. (D) (E) (F) (G) (H) (I) (J) (K) (L) (M) (N) continued on the next page. (D) Heatmap showing T2D GWAS signal colocalization with e,ca QTL. (E) T2D GWAS signal at the ARL15 locus is colocalized with an FAP caQTL. The genomic locus is shown at the top, followed by zooming into a ±1kb neighborhood of the caSNP rs702634. snATAC-seq profiles in five clusters by the caSNP genotype are shown, followed by aggregate profiles in all 13 clusters. (F) Locuszoom plots showing the ARL15 GWAS signal (top) followed by the caQTL signal in the five clusters. The peak was not testable for caQTL in the type 2a and endothelial clusters due to low counts. (G) Hi-C chromatin contacts at 5kb resolution imputed by EPCOT using the FAP snATAC-seq data (shown below the heatmap) in a 1Mb region over rs702634. (H) Difference in the predicted normalized chromatin contacts using FAP ATAC-seq from samples with the high accessibility genotype (GG) and low accessibility genotype (AA) at rs702634. Interactions with rs702634 highlighted in black are shown as a signal track below the heatmap. (I) Genes in the 1Mb neighborhood of the ARL15 gene. Chromatin co-accessibility scores between the caPeak and TSS+1kb upstream peaks for the neighboring genes, classified by genotype classes at rs702634. Distance of the TSS peak to the caPeak in kb is shown in parentheses. (J) GWAS signals for T2D and insulin fold change (IFC) at the C2CD4A/B colocalize with a caQTL in type 1,2a and 2x fibers. Shown are the genomic locus, snATAC-seq profiles by the caSNP genotype and aggregated in clusters. (K) Locuszoom plots showing the C2CD4A/B GWAS and caQTL signals. (L) Micro-C chromatin contacts imputed at 1kb resolution by EPCOT using the type 1 snATAC-seq showing rs7163757 and the neighboring 500kb region. (M) Difference in the predicted normalized chromatin contacts by rs7163757 genotype. Interactions with rs7163757 highlighted in black are shown as a signal track below. (N) A massively parallel reporter assay in the muscle cell line LHCN-M2 tested a 198bp element centered on the caSNP rs7163757. Enhancer activity is measured as log2(RNA/DNA) normalized to controls.
