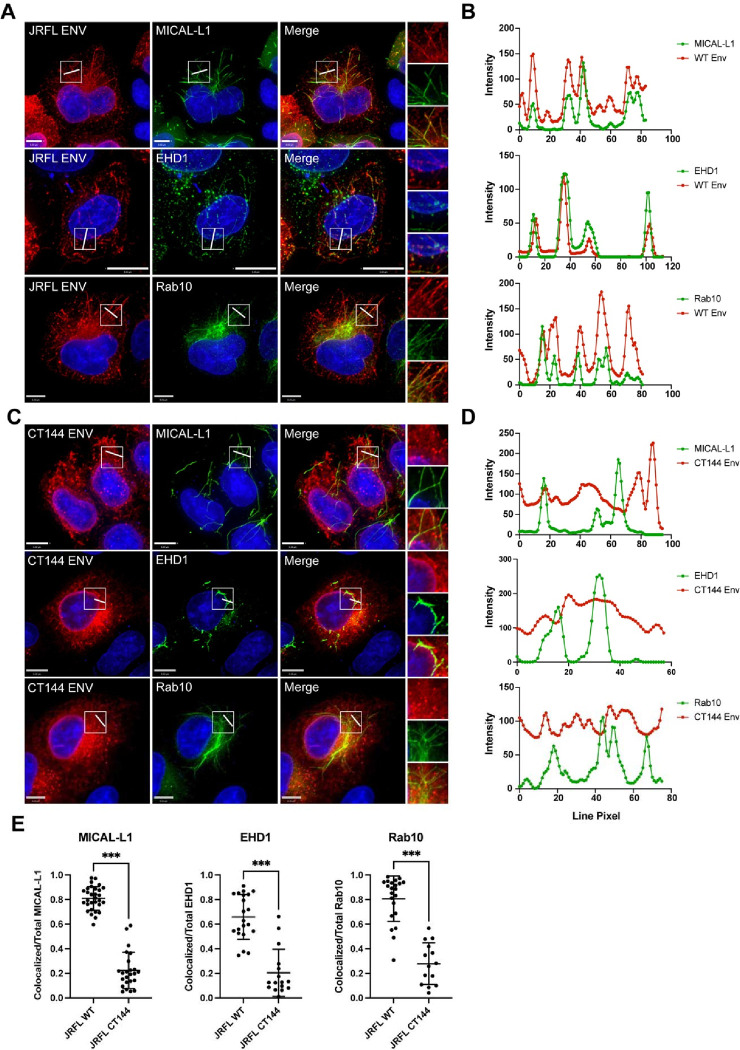
Figure 2. Env colocalization with the TRE requires an intact CT.
(A) Env with a full-length CT was examined in cells together with staining for MICAL-L1, EHD1, and Rab10. A region of interest was selected for measuring intensity plots (boxed region and rightmost panels). (B) Linear intensity profiles were measured across tubules marked by TRE proteins, and compared with intensity of Env signal from (A). Note co-occurrence of intensity peaks of red and green pixels. (C) CT144 Env was expressed, and the procedure for generating intensity plots across TRE tubules was repeated. (D) Intensity plots for TRE markers (green) and CT144 Env (red), showing lack of concurrence of intensity peaks. (E) Manders’ correlation coefficient was measured as colocalized pixels/total pixels of each TRE marker from cells in (A) and (C) and is reported as mean ± SD. Significance was assessed using unpaired T-test. ***, P<0.001.

