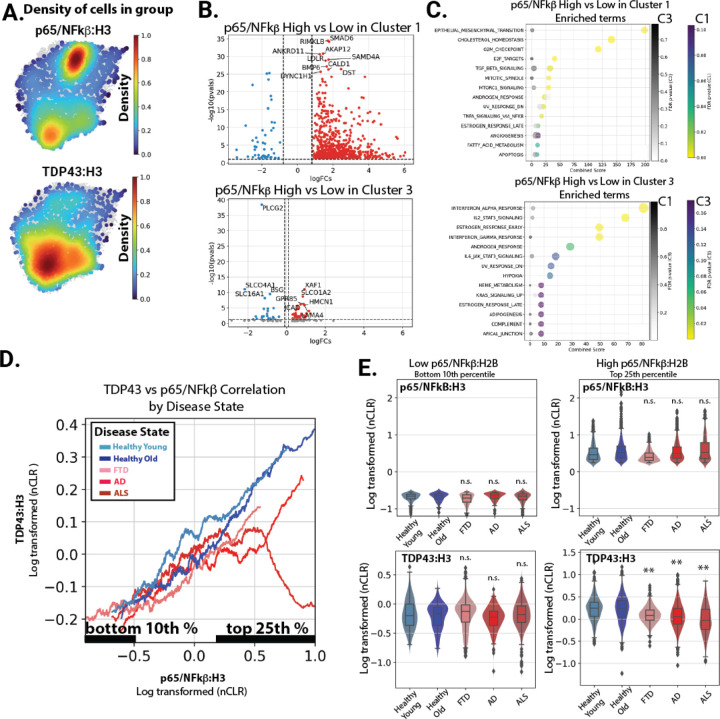
Figure 6. inCITE-seq analysis reveals a specific loss of nuclear TDP-43 and increased NFkB transcriptional targets disease associated nuclei.
(A) Density plots illustrating the top 10th percentiles of protein levels for p65/NFkB, Beta-Catenin, and TDP-43. (B) Transcripts positively associated with the highest (top 10th percentile) of nuclear p65/NFkB relative to the lowest (bottom 25th percentile) in each cluster. (C) GSEA Enrichr analysis of MSigDB pathways highest in the genes upregulated with p65/NFkB in cluster 1 and cluster 3, respectively. Enrichment of the pathways shown for each cluster are also shown in grey for the other cluster. (D) A smoothed line plot comparing NFkB protein levels (x-axis) to TDP-43 (y-axis). (E) Violin plot showing histone normalized protein levels for p65/NFkB and TDP-43 in bottom 10th percentile and top 25th percentile of p65/NFkB. Significance relative to healthy aged control is shown.

