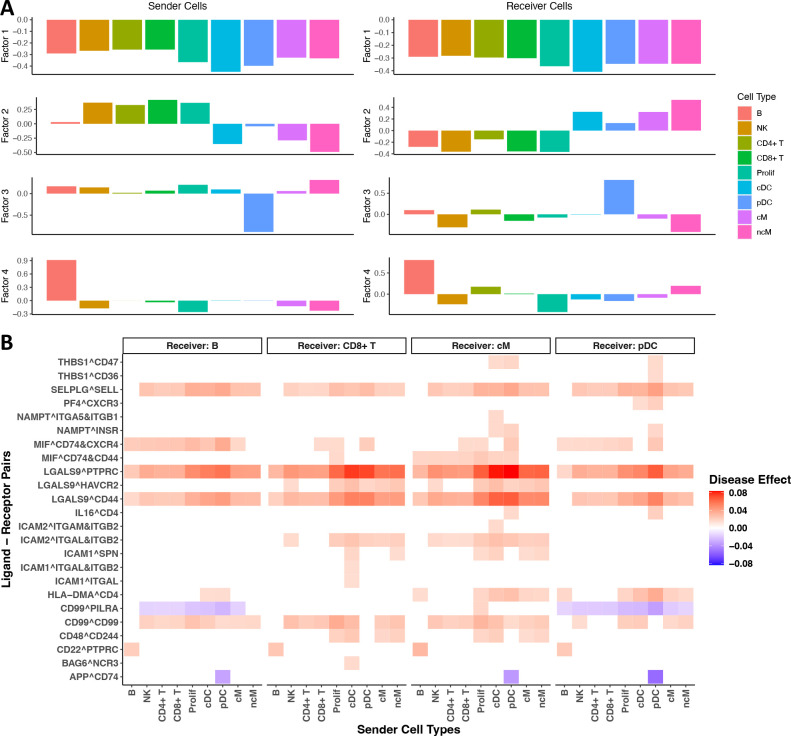
Figure 2. STACCato results with the SLE dataset.
(A) Bar plots of the estimated values in the factor matrices of sender and receiver cell types. Each color represents one cell type. (B) Estimated significant disease effects with p-values < 0.05 and magnitudes > 0.015 for communication events with B, CD8+ T, cM, and pDC cells as receiver cell types. Positive disease effects are colored in red while negative disease effects are colored in blue. Positive disease effects indicate positive associations between CCC events and SLE, while negative disease effects indicate negative associations.

