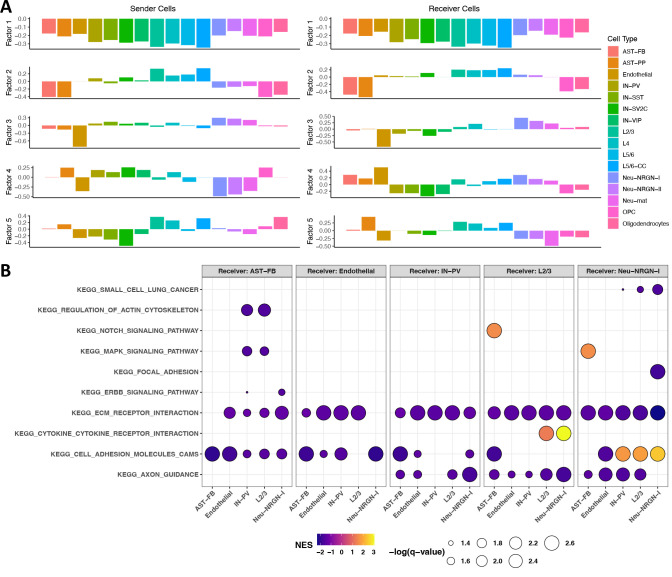
Figure 3. STACCato results with the ASD dataset.
(A) Bar plots of the estimated values in the factor matrices of sender and receiver cell types. Each color represents one cell type. (B) Significantly enriched KEGG pathways with false discovery rate (FDR) adjusted p-value (q-value) < 0.05 across AST-PP, Endothelial, IN-PV, L2/3, and Neu-NRGN-I sender and receiver cell types. Colors represent the normalized enrichment scores. Positive enrichment scores indicate positive associations with ASD, while negative enrichment score indicate negative associations with ASD.

