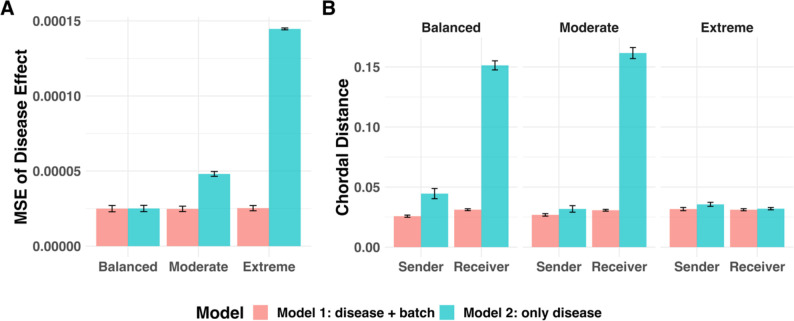
Figure 4. STACCato simulation results:
MSE of estimated disease effects (A) and chordal distance of estimated factor matrices (B) in balanced, moderate unbalanced, and extreme unbalanced scenarios. The bar plot shows the average MSEs across 100 simulations from Model 1 considering disease status and batch (red bars) and Model 2 considering disease status only (green bars) with black error bars showing standard errors.

