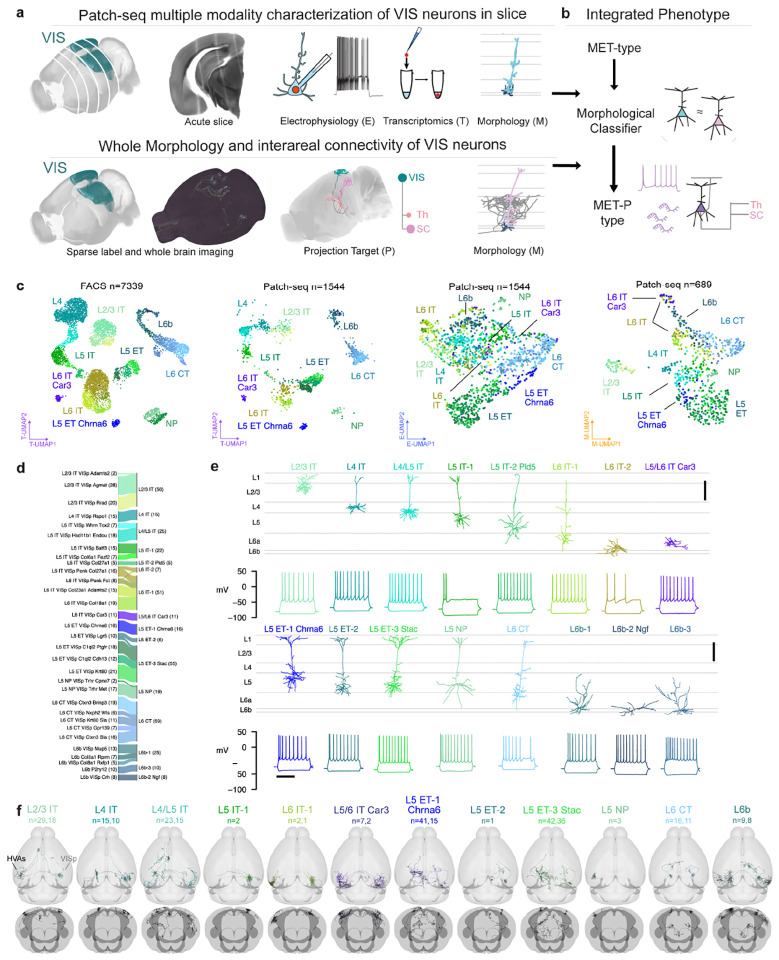
Figure 1:
a, Schematic of parallel experimental strategies. b, Integration of the two datasets based on shared dendritic properties. c, UMAPs based on principal components of gene expression (left: dissociated cells, second from left: cells from Patch-seq recordings), electrophysiology features (second from right) and morphology features (right), with T-types shown in colors. Broader transcriptomic subclasses are labeled for clarity. d, River plot showing the relationships between T-types (left) and assigned MET-types (right) for cells from Patch-seq recordings with all three data modalities available. e, Example cortical layer-aligned morphological reconstructions and electrophysiological responses for each excitatory cortical MET-type. Electrophysiology examples include responses evoked by a hyperpolarizing current step (−70 or −90 pA), and the response evoked by a rheobase + 30 pA or + 40 pA stimulus. f, Whole neuron morphologies (WNM) registered to the Allen CCFv3, horizontal and frontal views. Each panel shows individual WNMs located in VISp (right) and/or HVAs (left), that were classified into an integrated MET-type using local morphology features.

